
After a terrible, horrible, no good, very bad month in June, the number and severity of significant Internet disruptions observed in July was markedly lower. The month was book-ended by exam-related outages, while other observed connectivity disruptions were related to a massive power outage, severe weather, government direction, and fiber/cable issues. Several additional unattributed disruptions were also seen over the course of the month.
National Exams
After ending June with regional Internet disruptions reportedly intended to prevent student cheating on national Physics exams in Iraq, there were six additional nationwide disruptions observed over the first half of July, as seen in the figures below. Multi-hour disruptions took place on July 1, 4, 7, 10, 13, and 15. Published reports indicate that the Internet was again disrupted at the request of the education ministry in an effort to prevent student cheating. Iraq has been implementing such tactics since 2015.
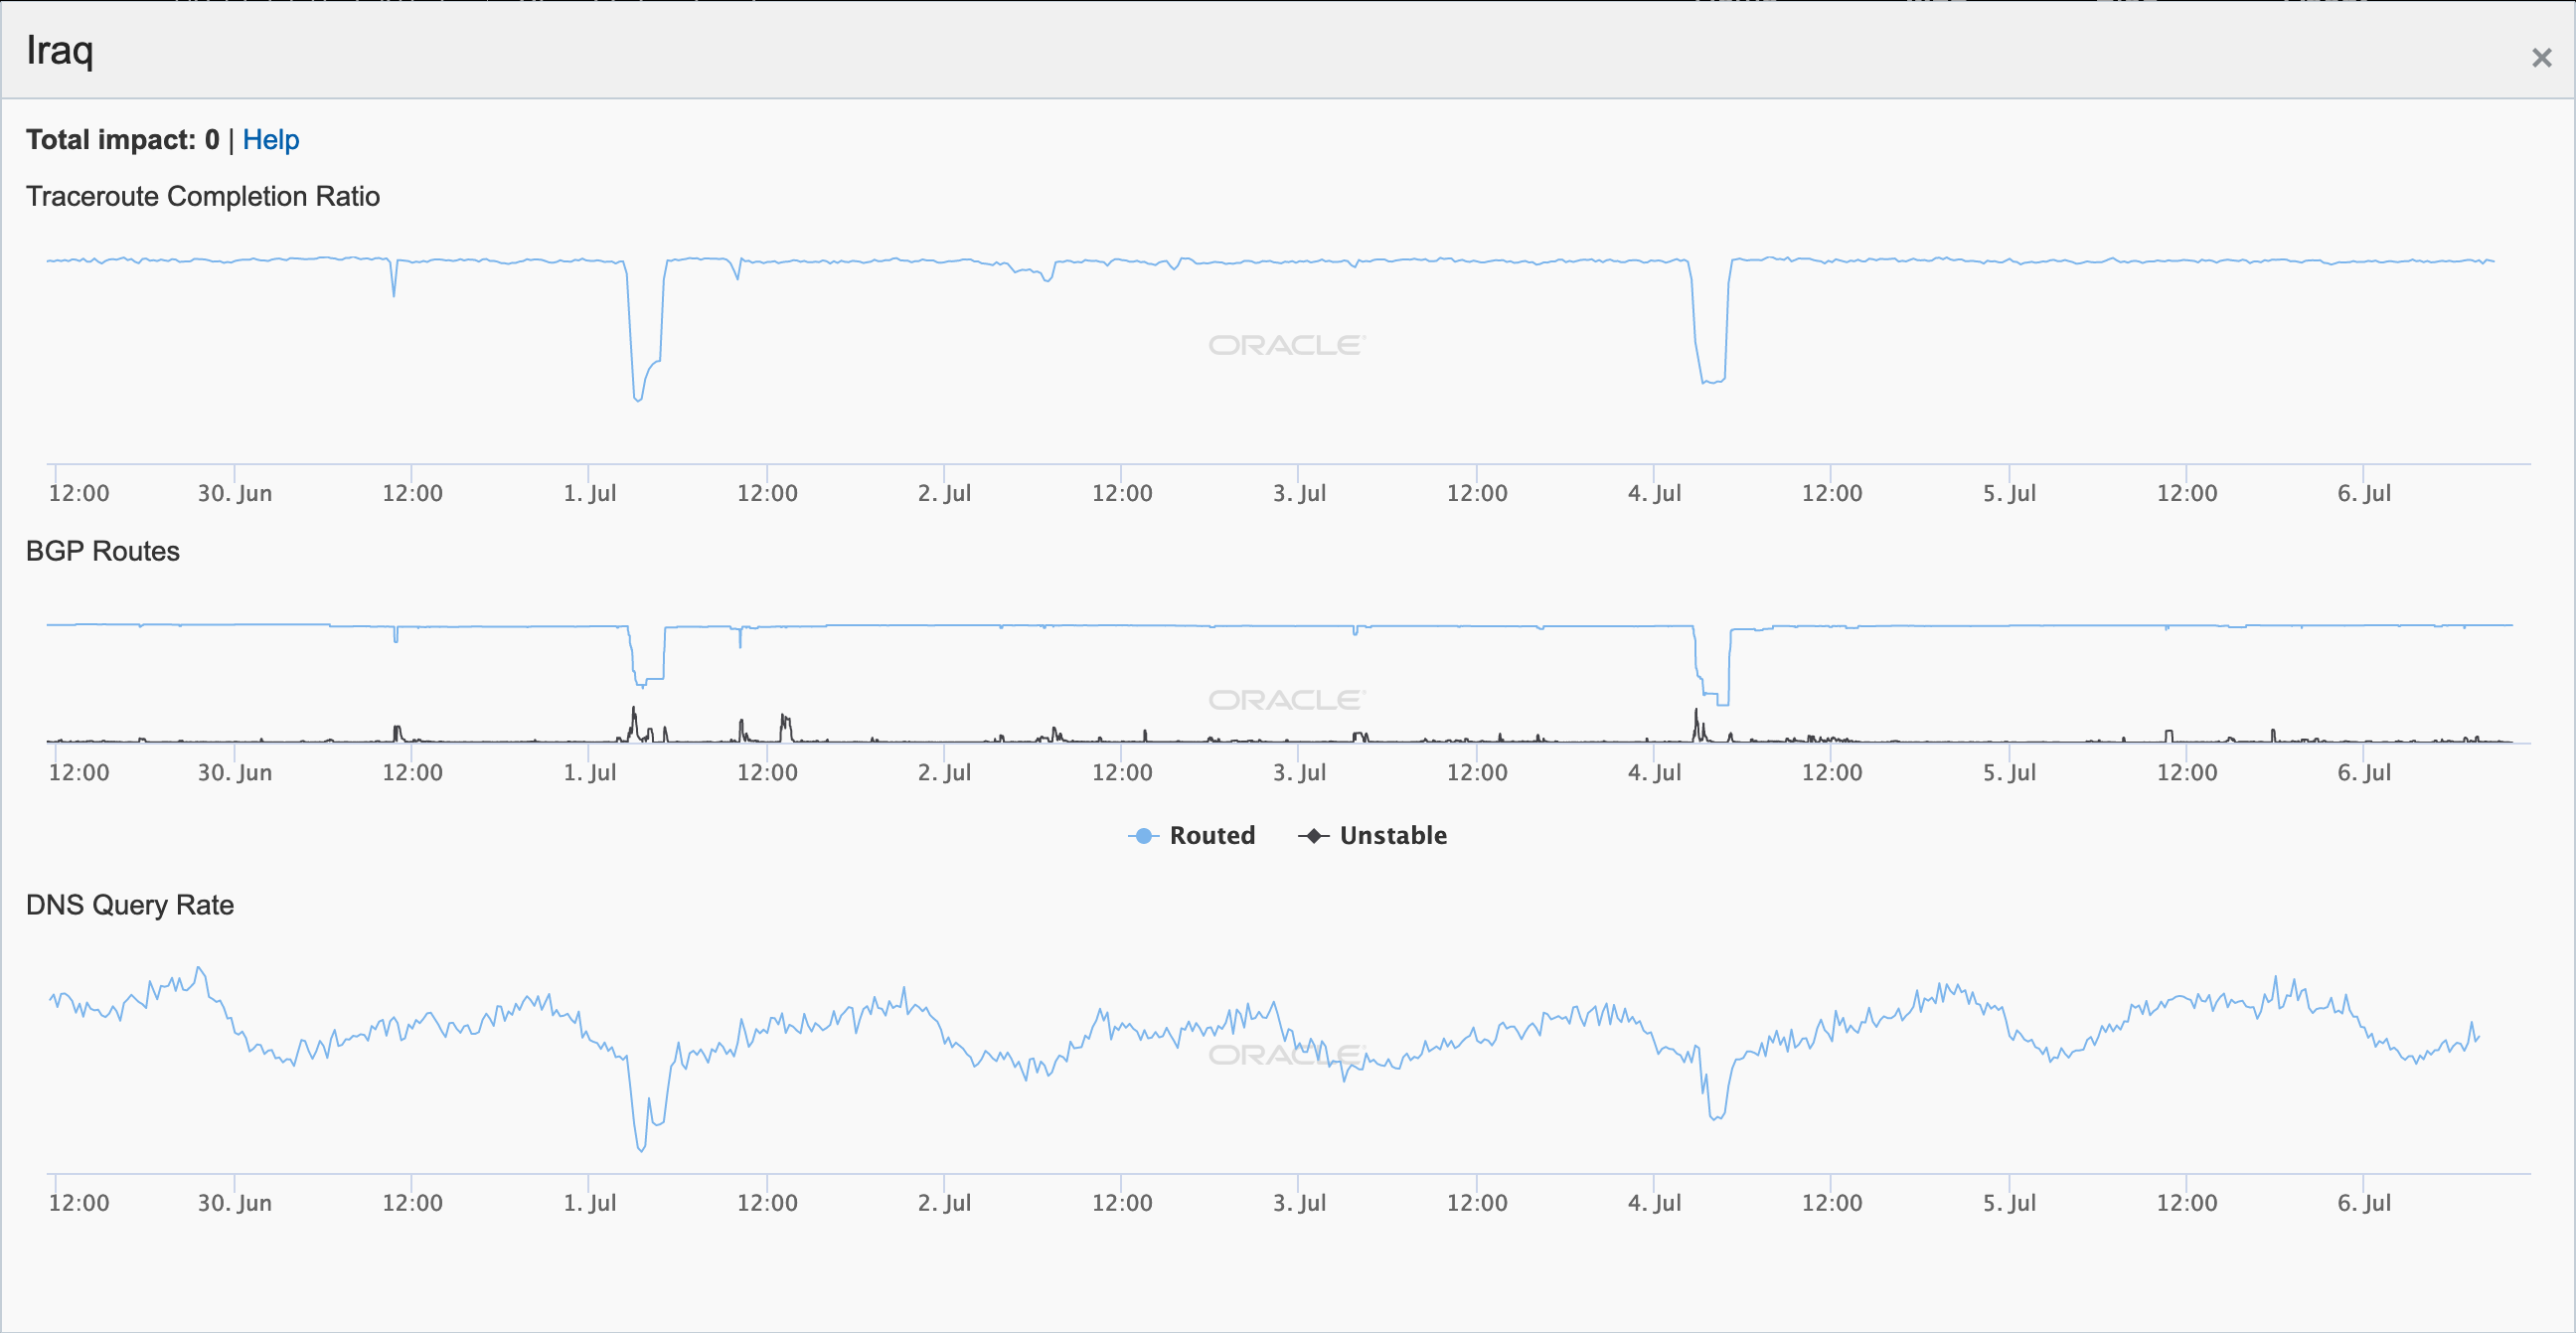
Oracle Internet Intelligence graph for Iraq, July 1-4 
Oracle Internet Intelligence graph for Iraq, July 4-7 
Oracle Internet Intelligence graph for Iraq, July 7-10 
Oracle Internet Intelligence graph for Iraq, July 13-15 
Google Transparency Report traffic graph for Iraq, July 1-16
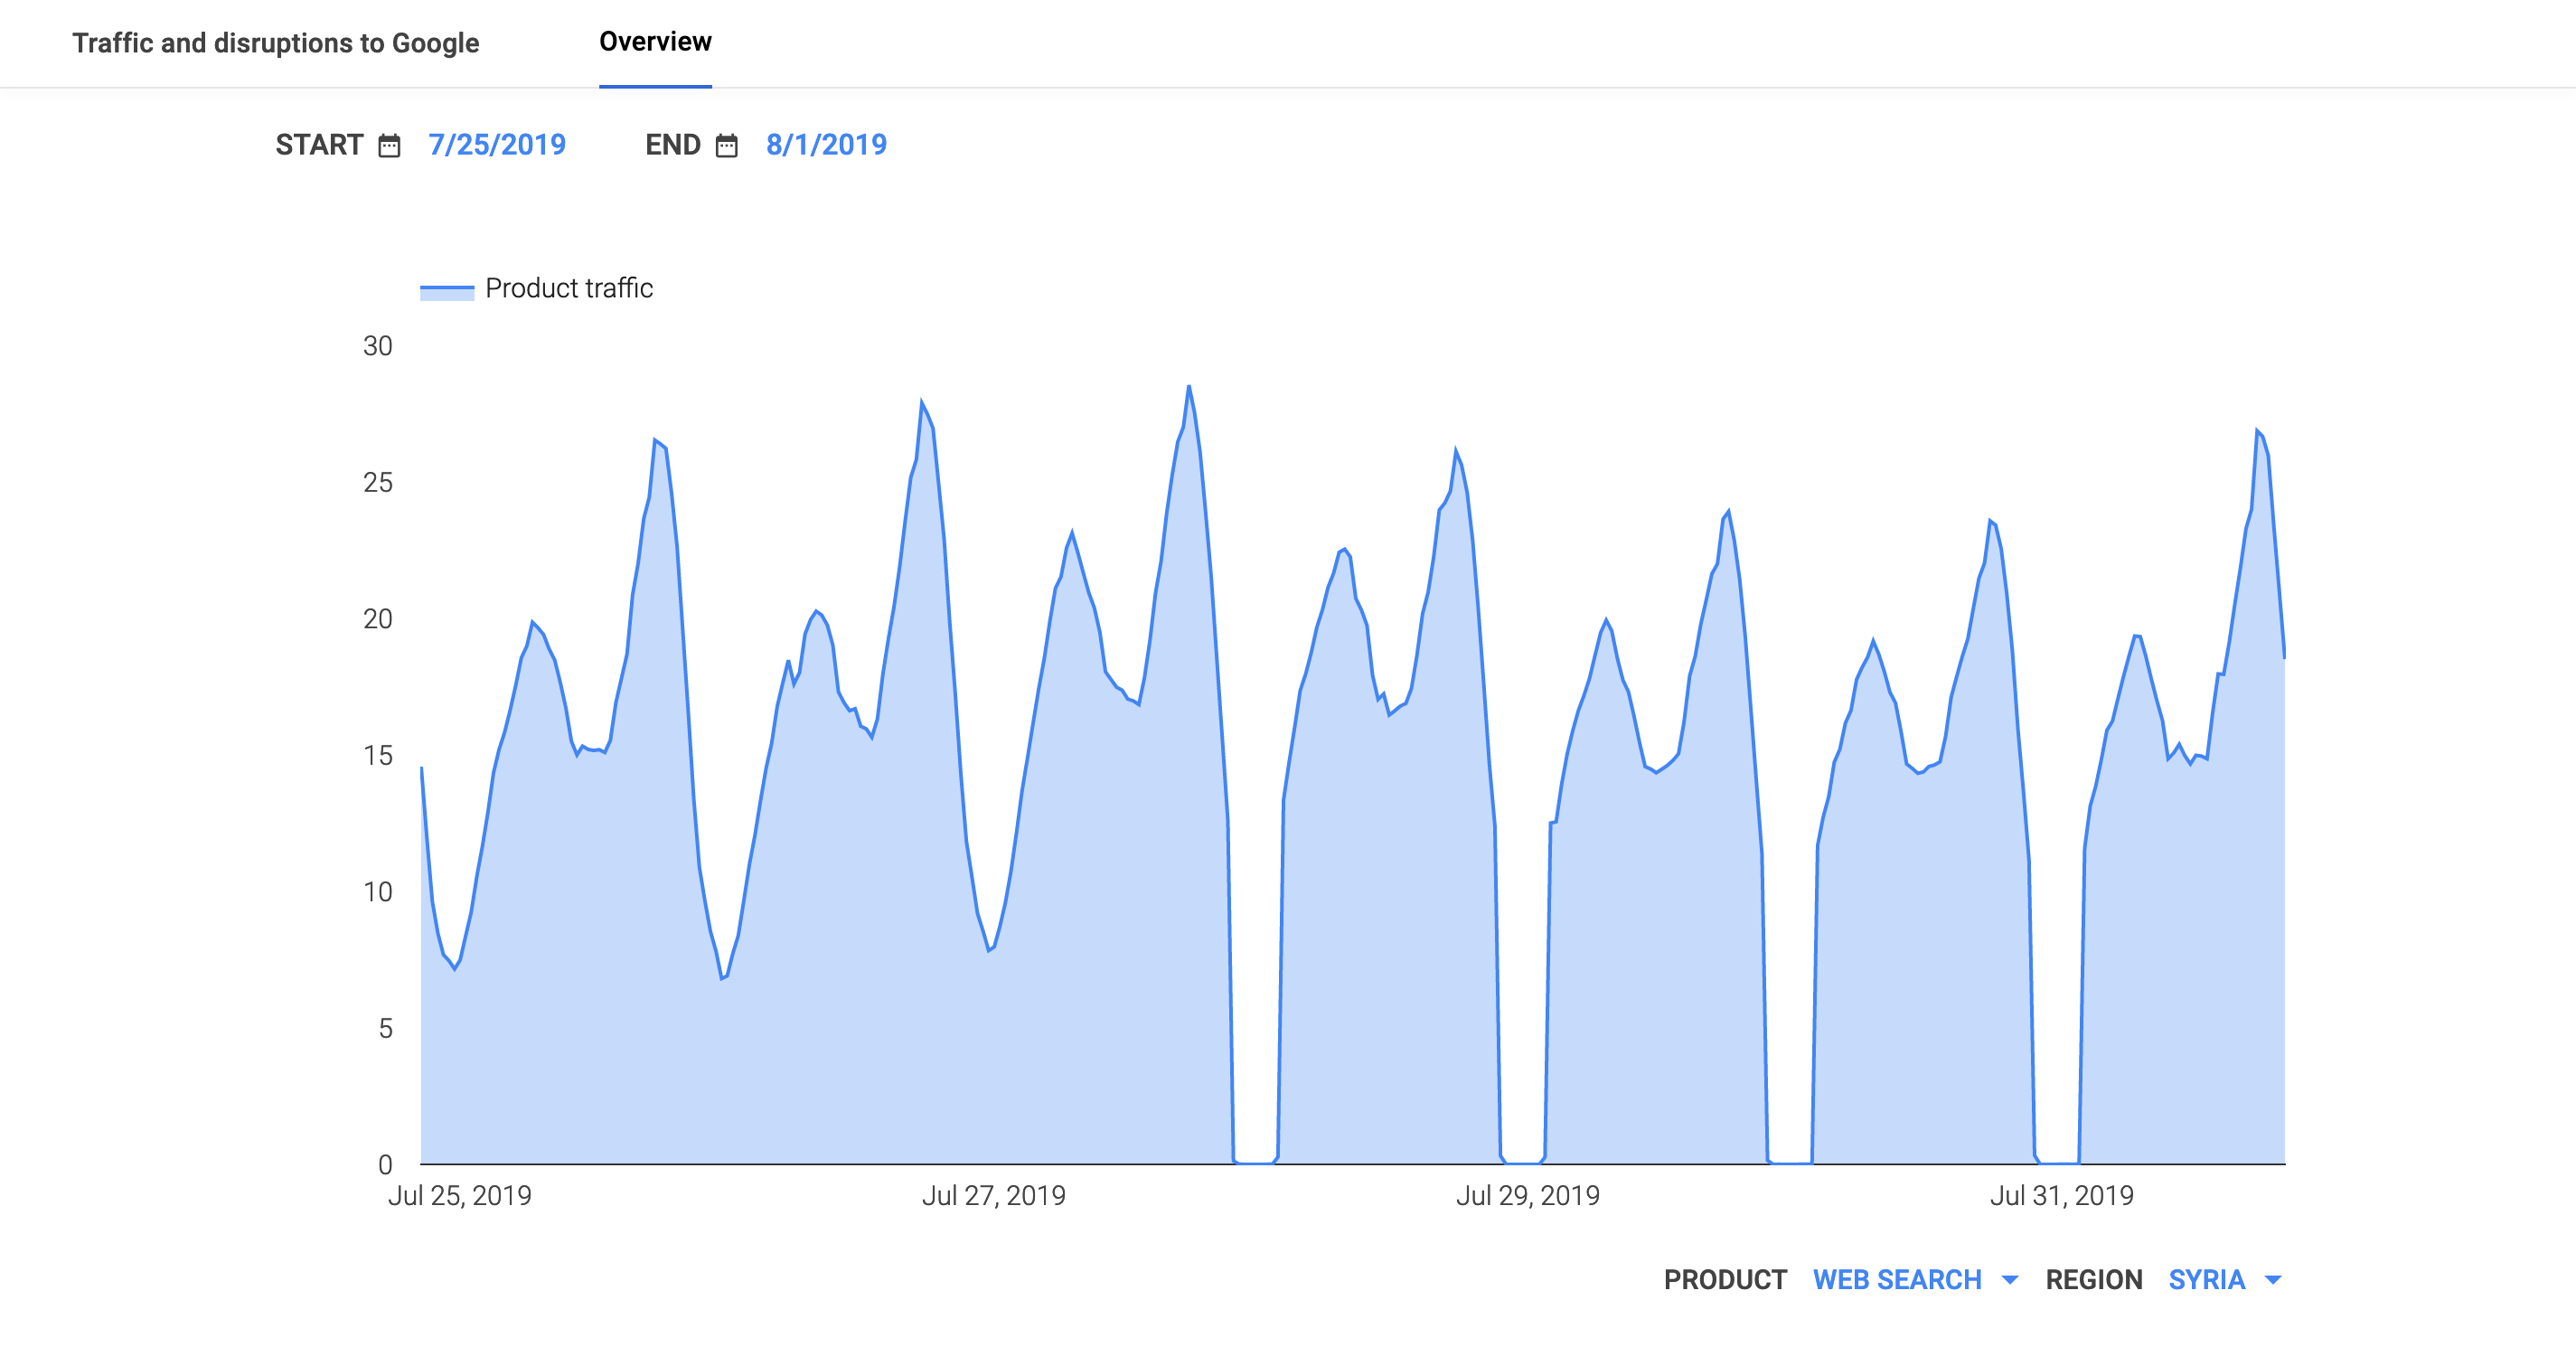
After five exam-related Internet disruptions were observed in Syria during the first three weeks of June, another four were observed across the last days of July, as seen in the figures below. The impact is shown at a country level, as well as for AS29256 (Syrian Telecom), the state-affiliated telecommunications provider. Although no specific documentation of these disruptions being related to national exams could be found online (either in published reports or on the Syrian education ministry Web site), their frequency and duration closely resembles similar verified disruptions seen in the past. As such, they are being categorized as exam-related.
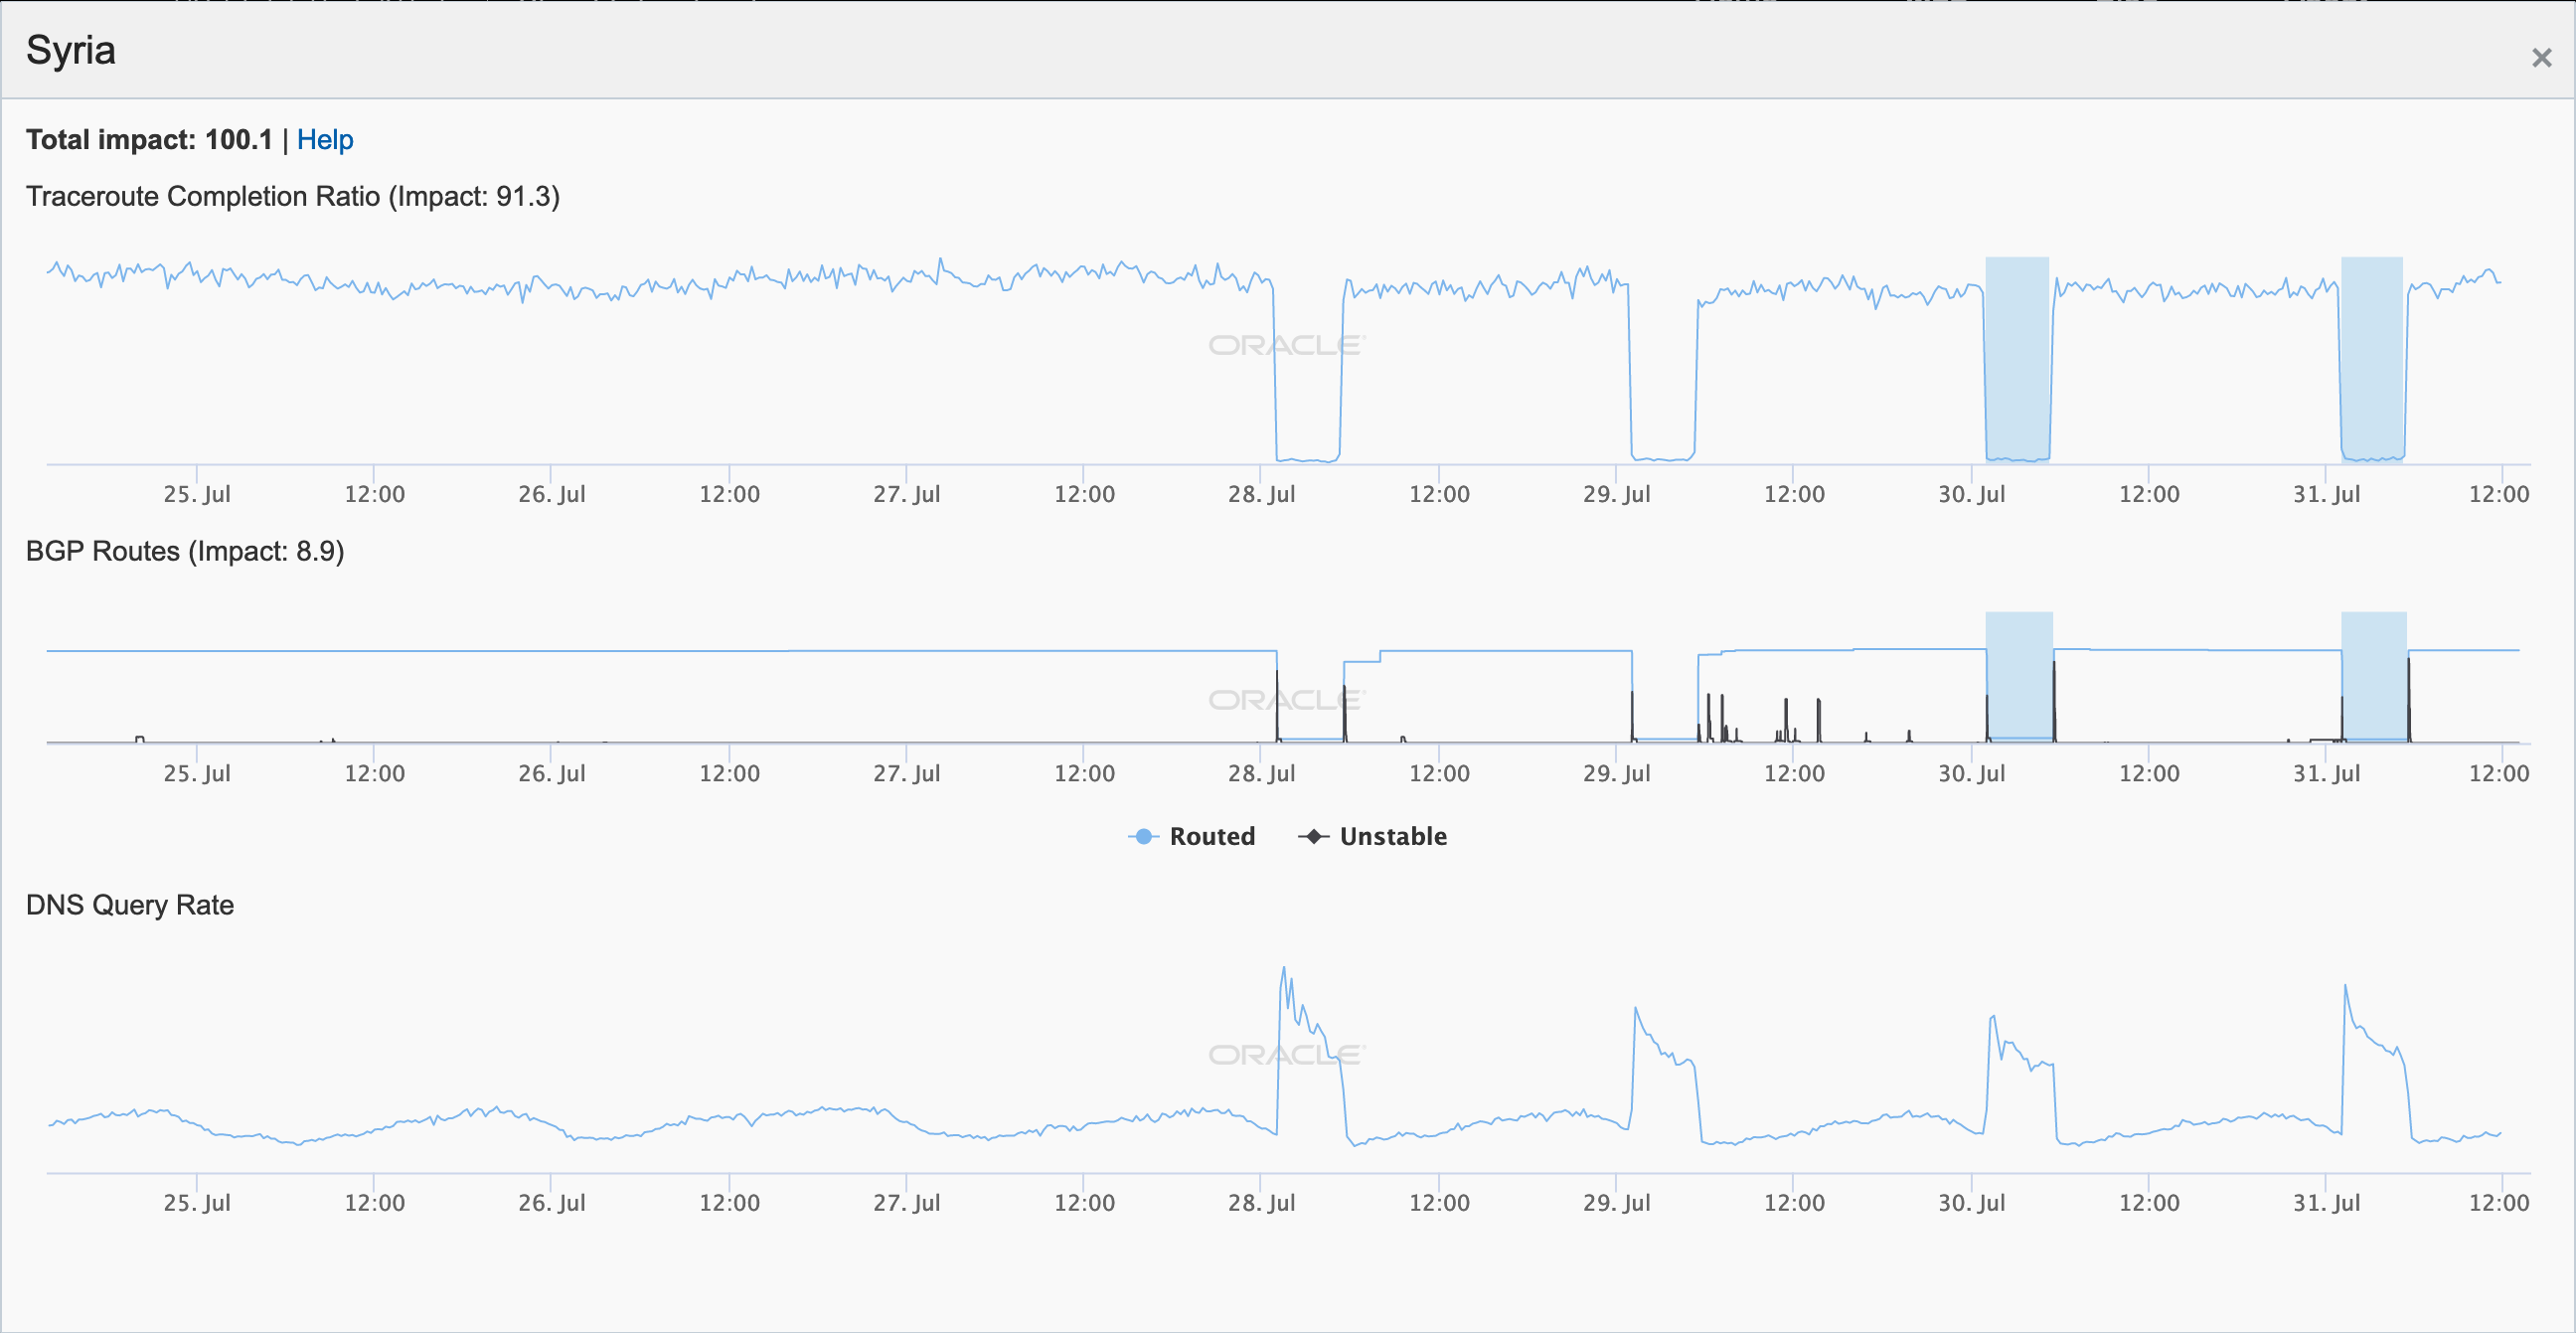
Oracle Internet Intelligence graph for Syria, July 25-31 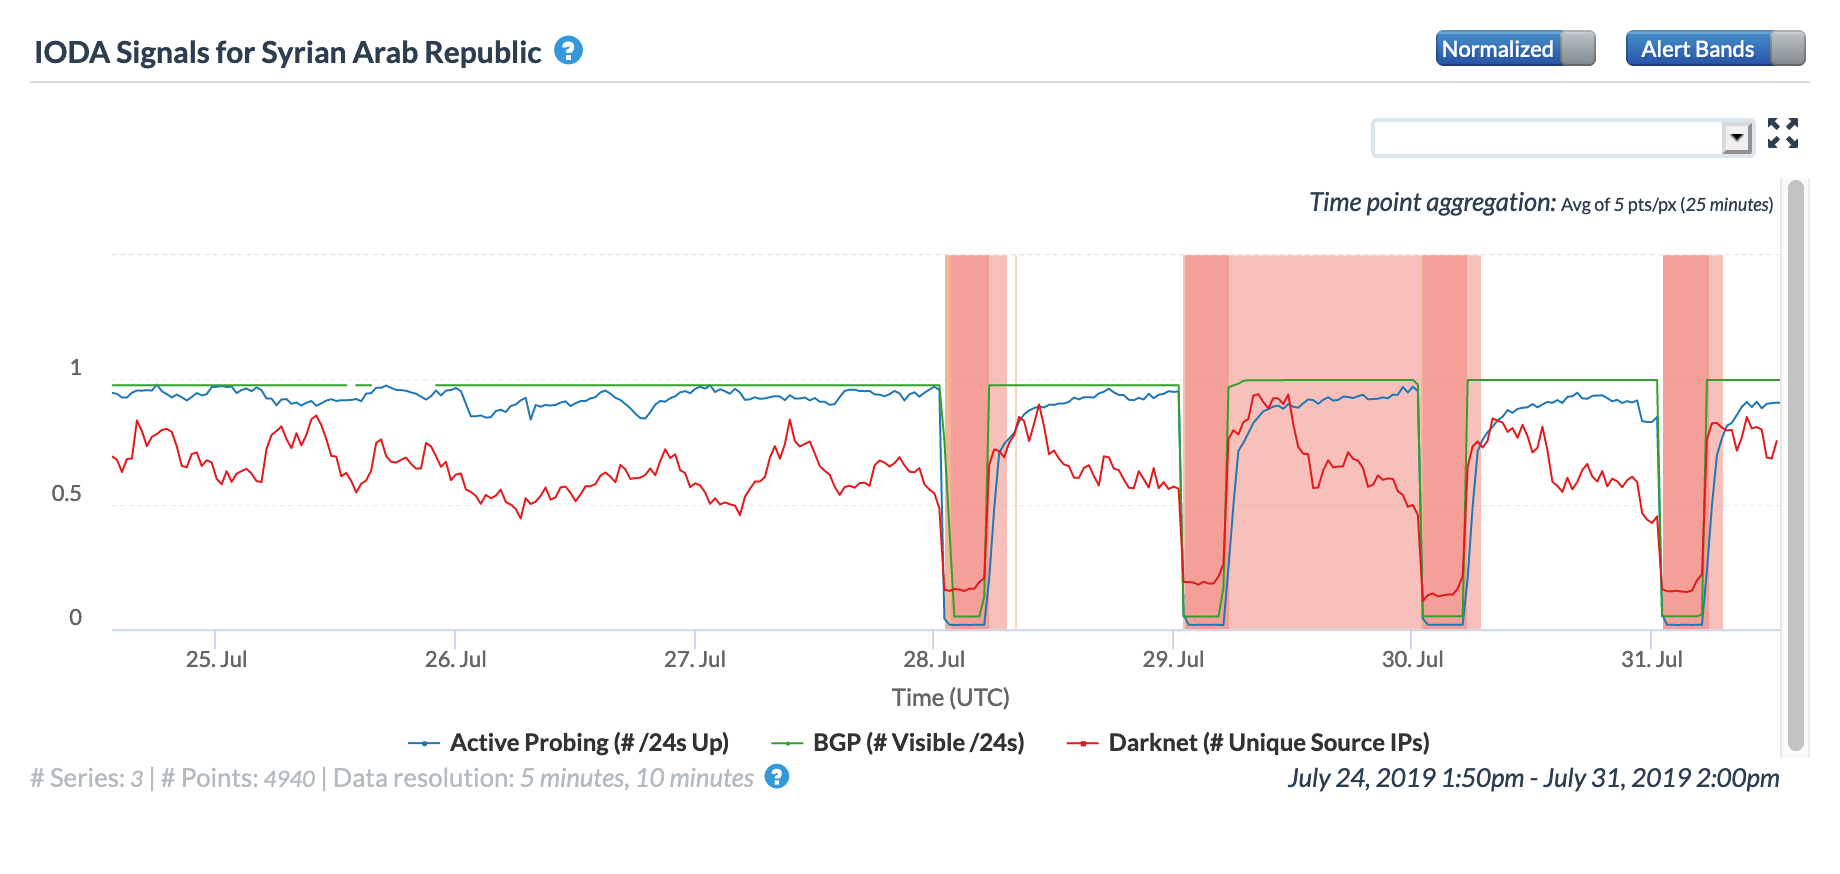
CAIDA IODA graph for Syria, July 25-31

Oracle Internet Intelligence graph for AS29256, July 25-31 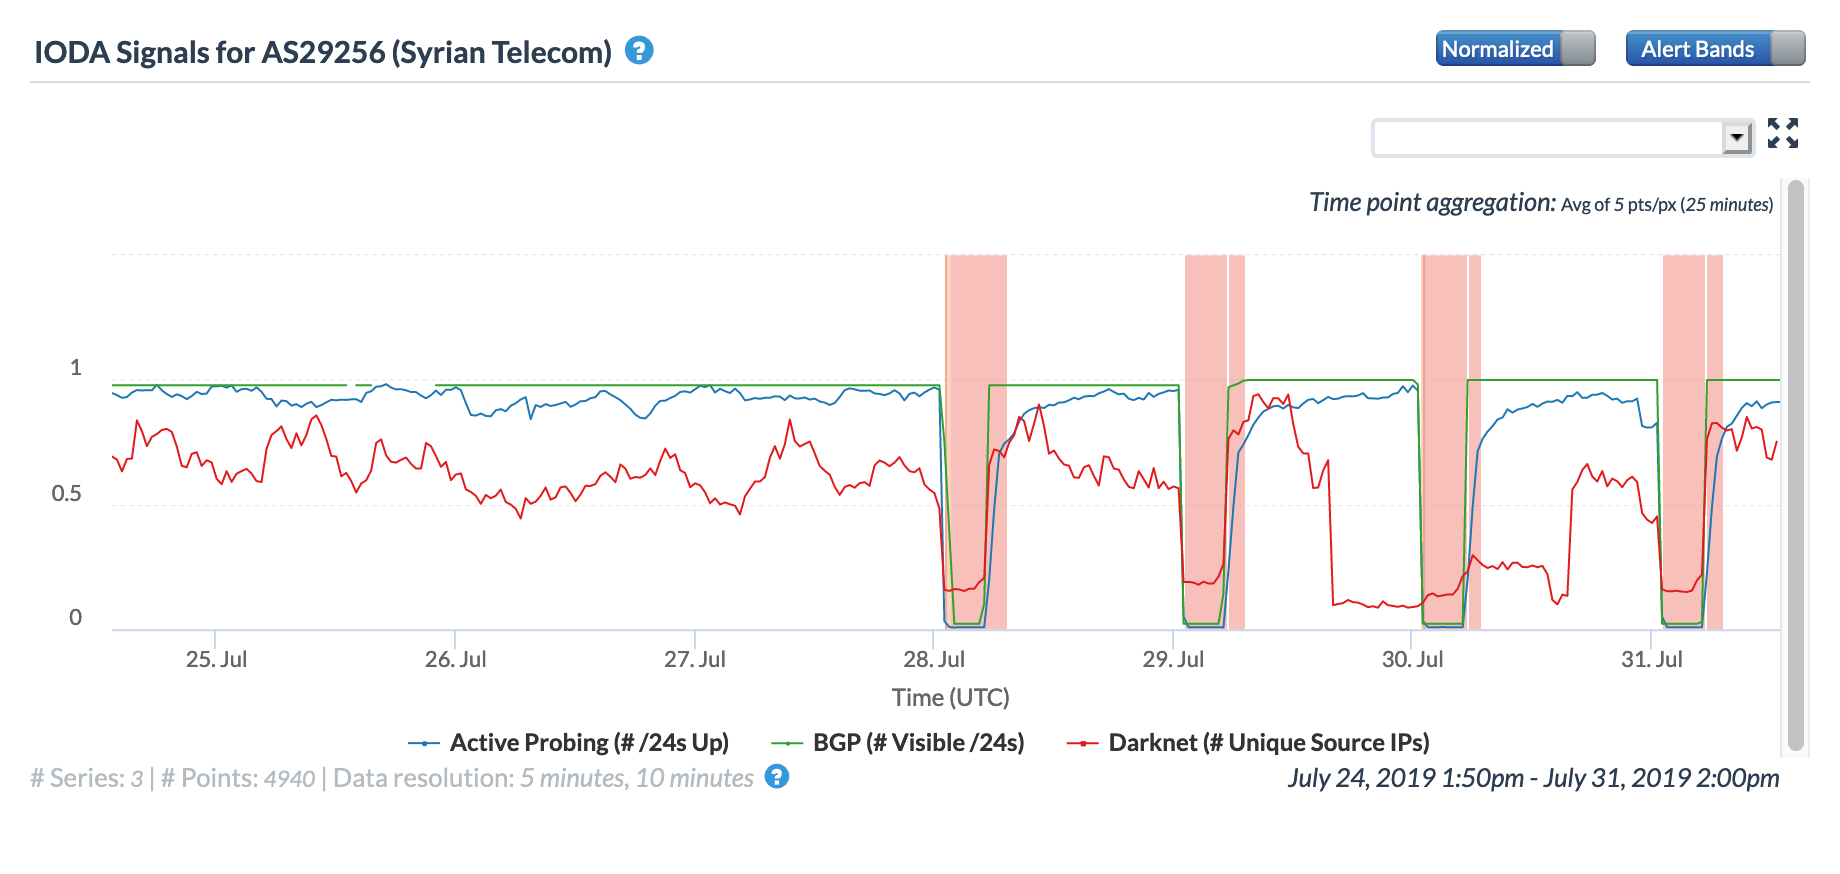
CAIDA IODA graph for AS29256, July 25-31
Power Outage
In its first major power outage since March, Venezuela suffered a massive blackout on July 22, plunging more than half of Venezuela’s 23 states into darkness. The figures below show that power failed around 20:00 GMT, ultimately disrupting Internet connectivity for more than a day. As illustrated in the Oracle Internet Intelligence and CAIDA IODA graphs, the active measurements (traceroute & ping) dropped immediately and took a significant amount of time to recover; the passive (user traffic) measurements (DNS, darknet, Google Web search) exhibited the same behavior. However, only minor churn is evident in Oracle’s and CAIDA’s BGP-based metrics, indicating that the routes to networks within the country remained available, even if endpoints on those networks were unreachable.
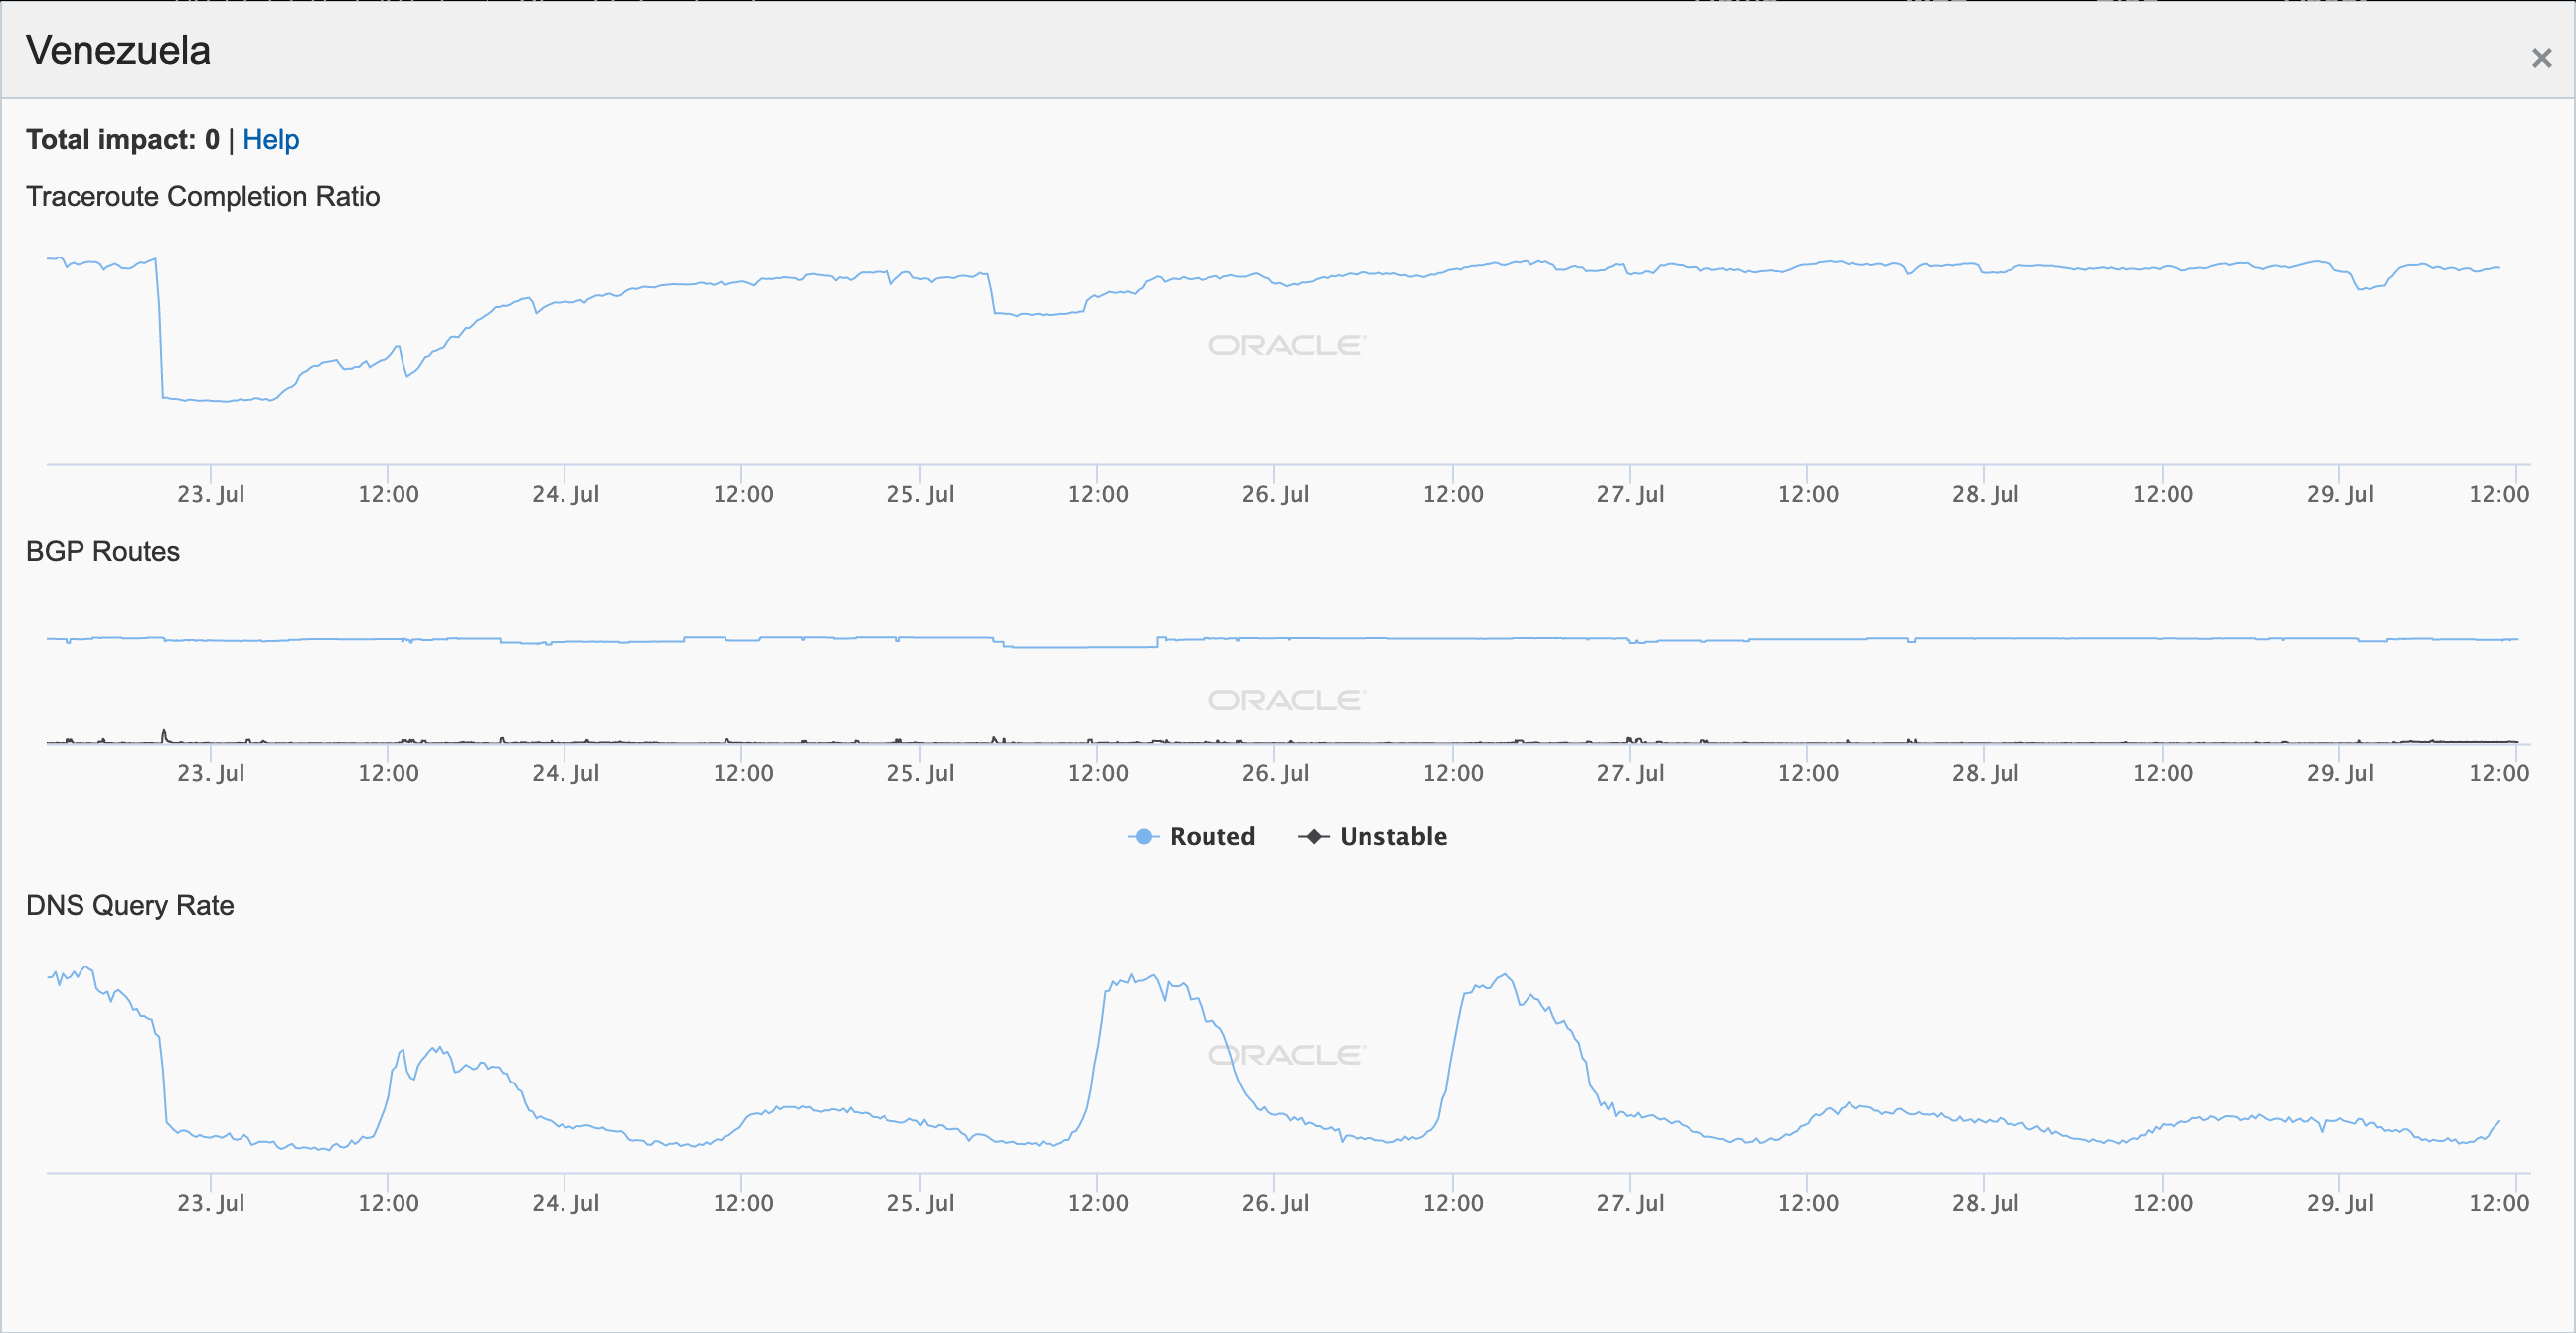
Oracle Internet Intelligence graph for Venezuela, July 22-29 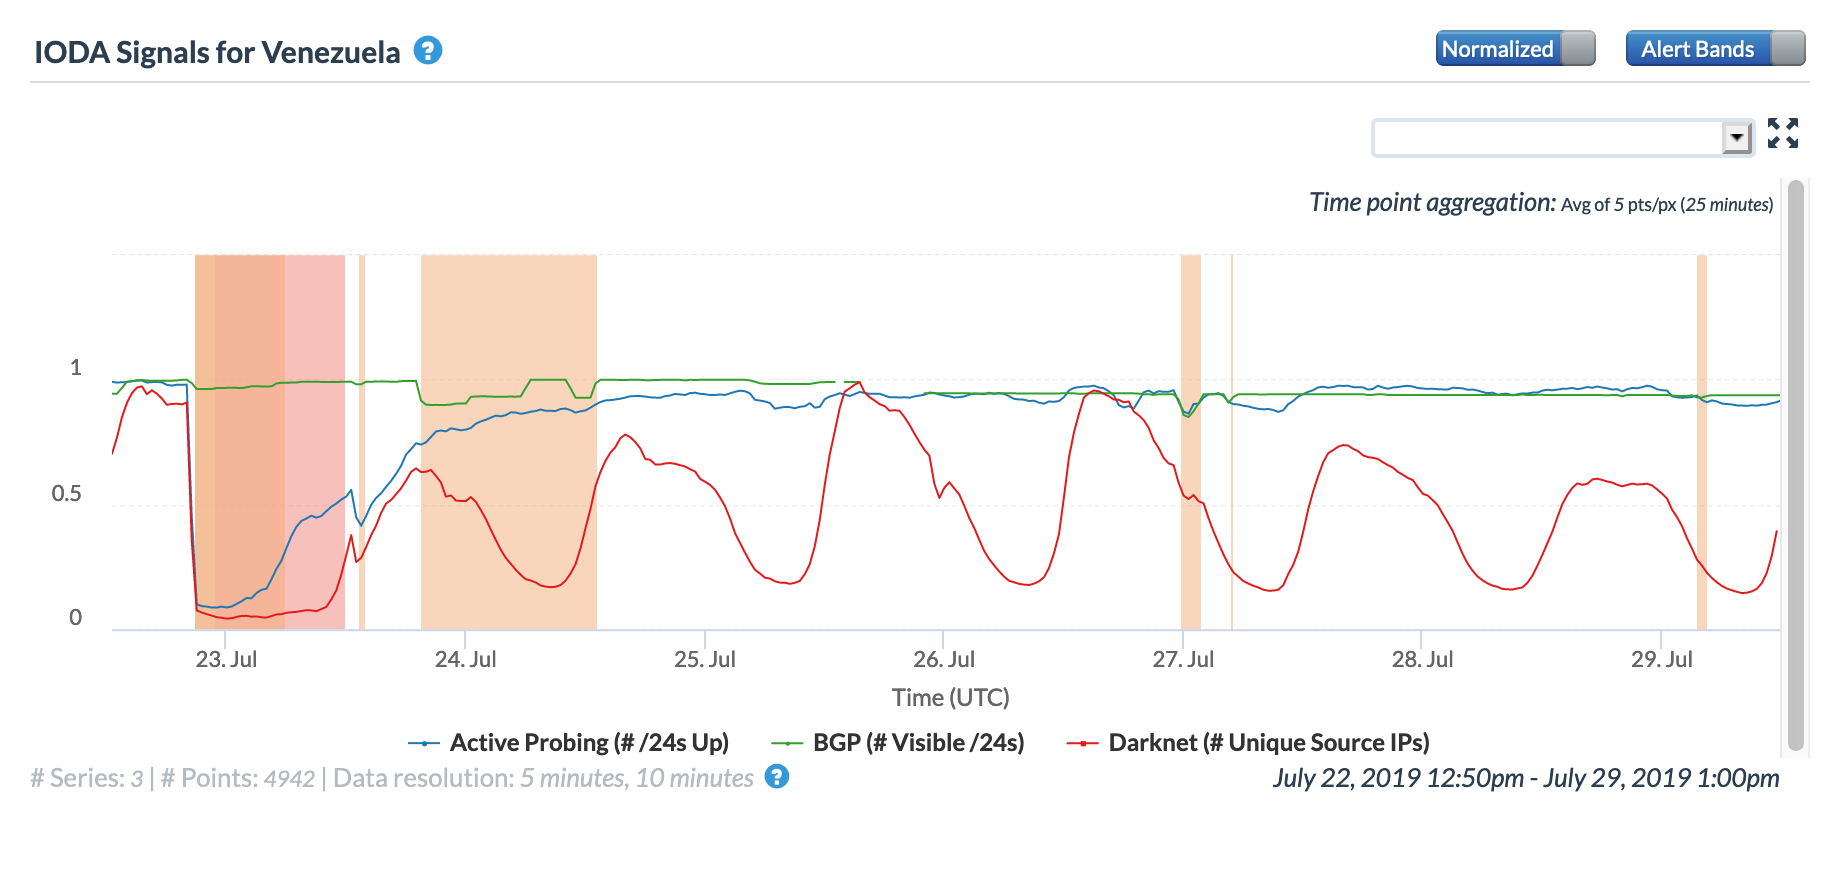
CAIDA IODA graph for Venezuela, July 22-29 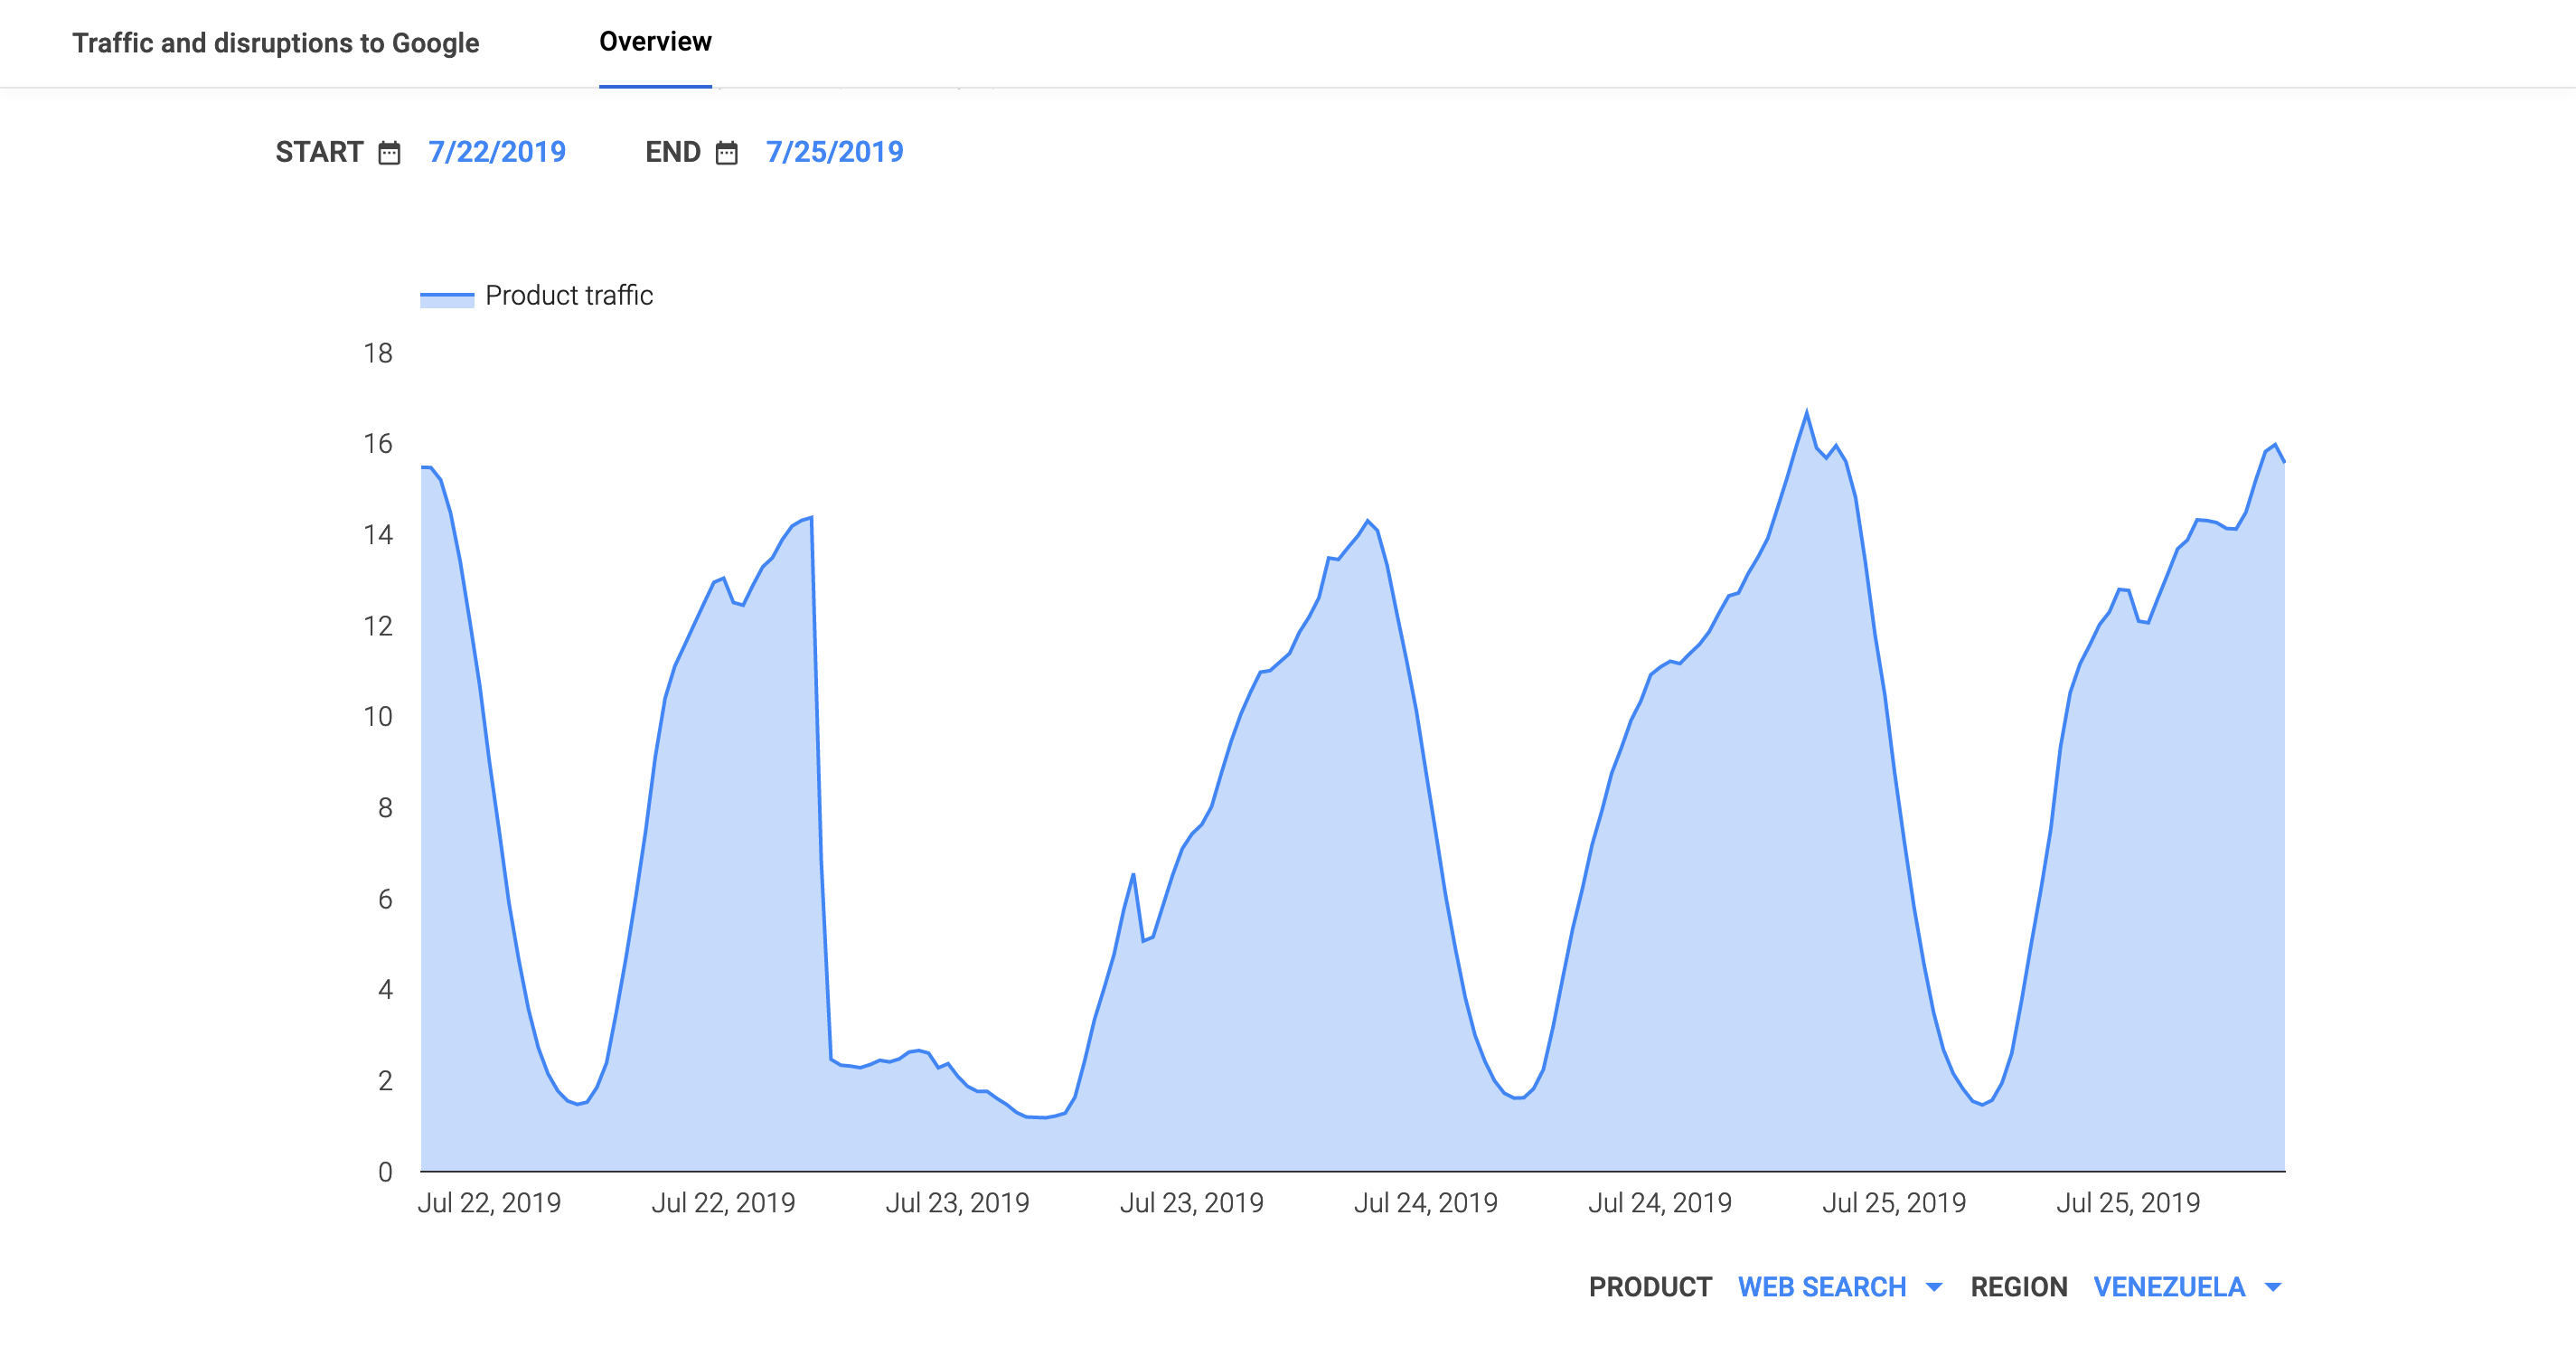
Google Transparency Report traffic graph for Venezuela, July 22-29
The @outagedetect Twitter account, associated with Internet connection and connected device monitoring company Fing, also observed the disruption within its monitoring of subscriber devices on CANTV, Venezuela’s state-run Internet service provider and posted the Tweet below:
Government Directed
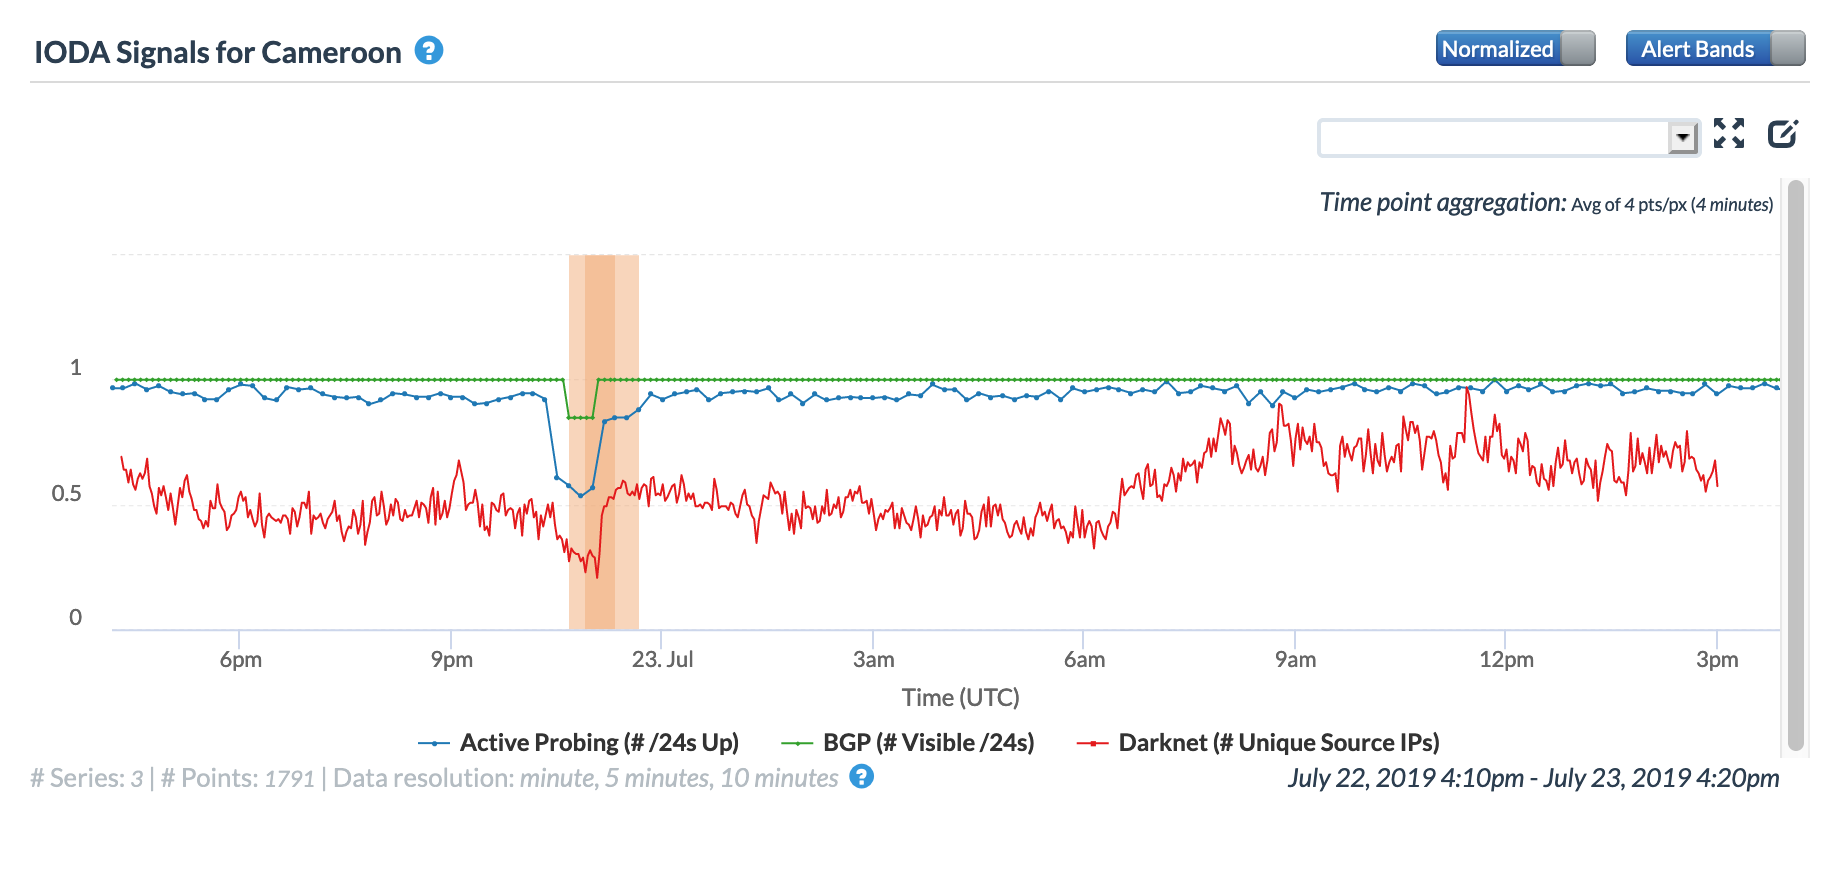
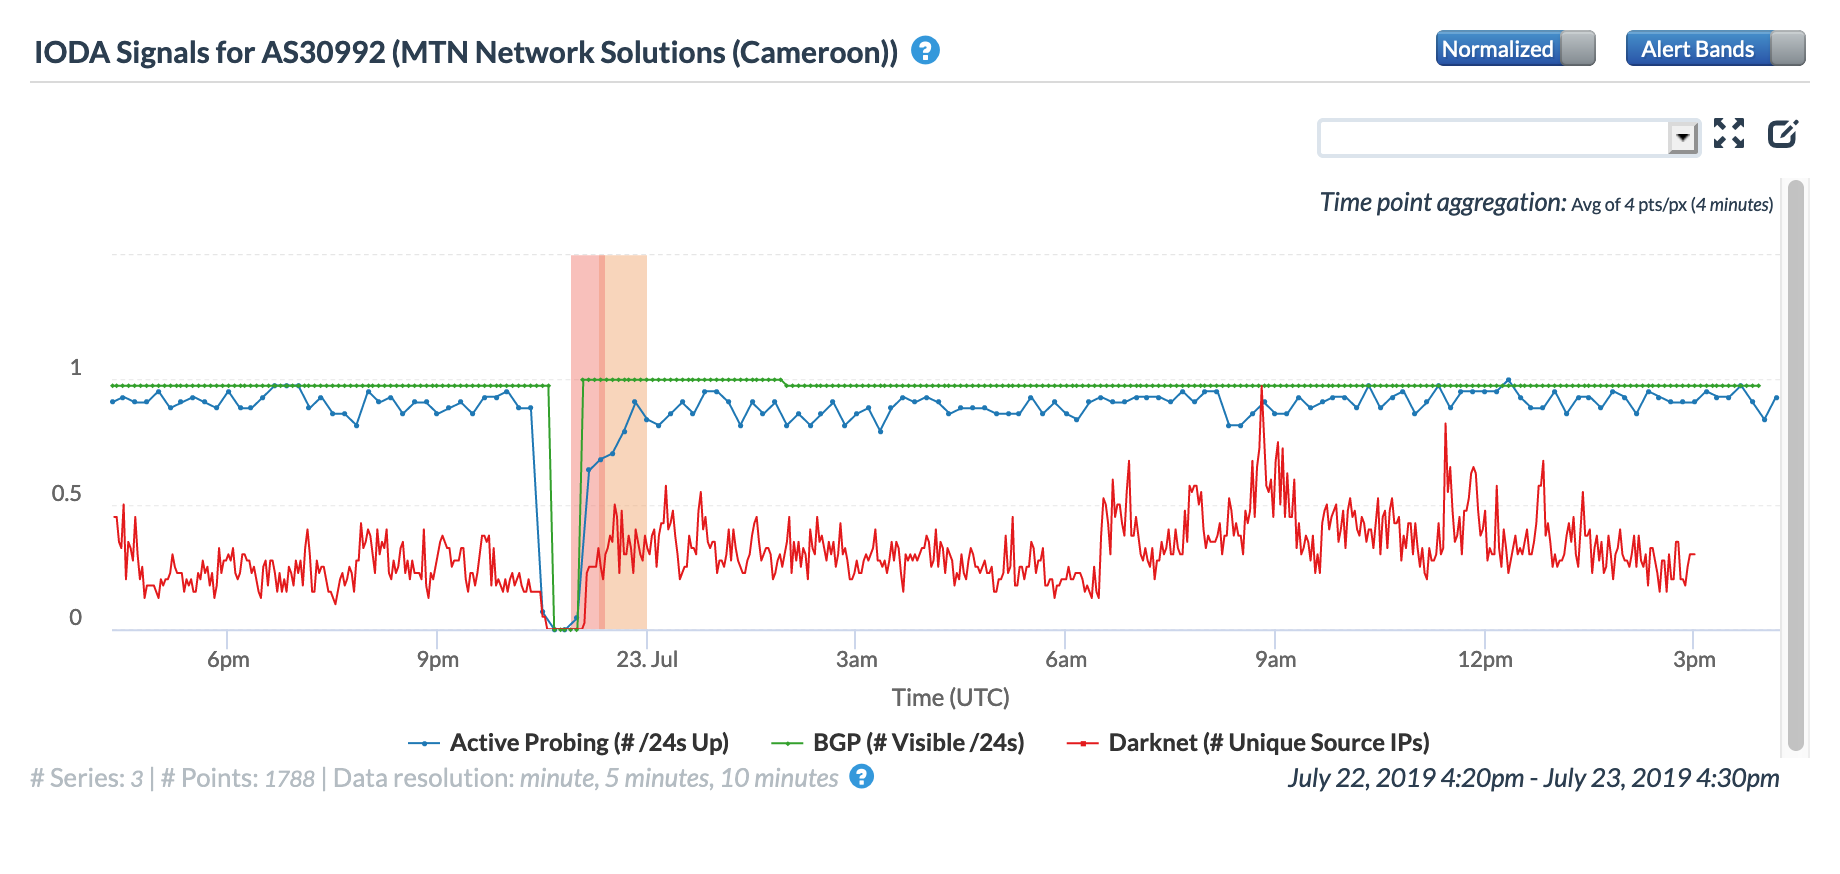
Also on July 22, a fire broke out at the Kondengui Central Prison in Cameroon’s capital city of Yaounde after detainees held a protest in the overcrowded detention facility. A published report noted “The internet was shut down while a drone was flown over the prison.” This shutdown is likely the root cause of the Internet disruptions shown in the graphs below, for both Cameroon at a country level, as well as for AS30992 (MTN Cameroon), a major network provider within the country.
Severe Weather
While this blog generally looks at country-scale Internet disruptions, the network impact of severe weather events is much more localized, wreaking havoc and causing connectivity problems across a much smaller geographic area.
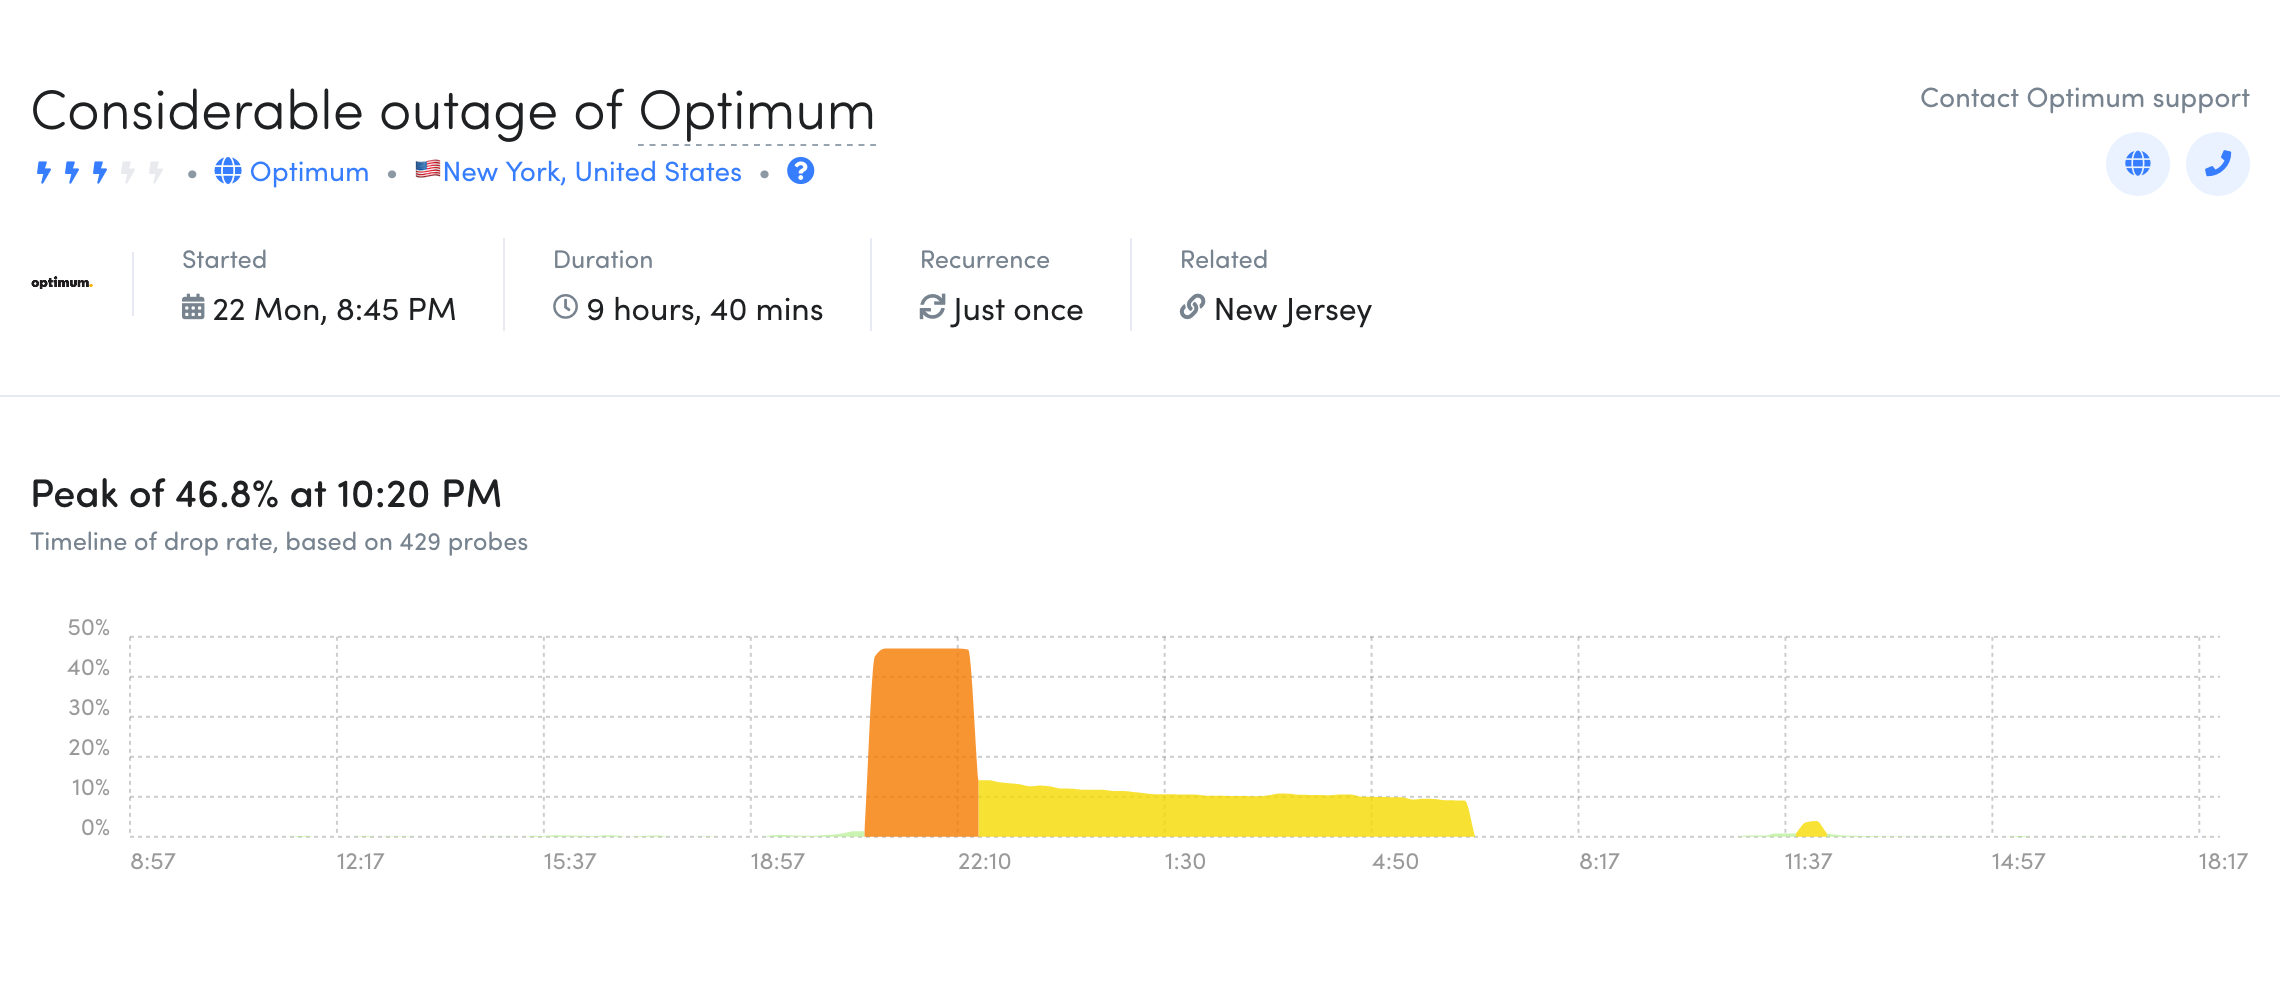
On July 23, Fing’s @outagedetect Twitter account highlighted a “considerable” outage impacting customers of network provider Optimum Online in New York & New Jersey.
Fing’s detail view showed that the disruption started at 20:45 (ET) on July 22, and lasted for nearly 10 hours. The disruption can also be seen in the CAIDA IODA graph below, with drops in the Active Probing and Darknet metrics seen for several hours, roughly aligned with the orange portion of the Fing graph. (Optimum Online is the high-speed Internet brand of Cablevision Systems.)
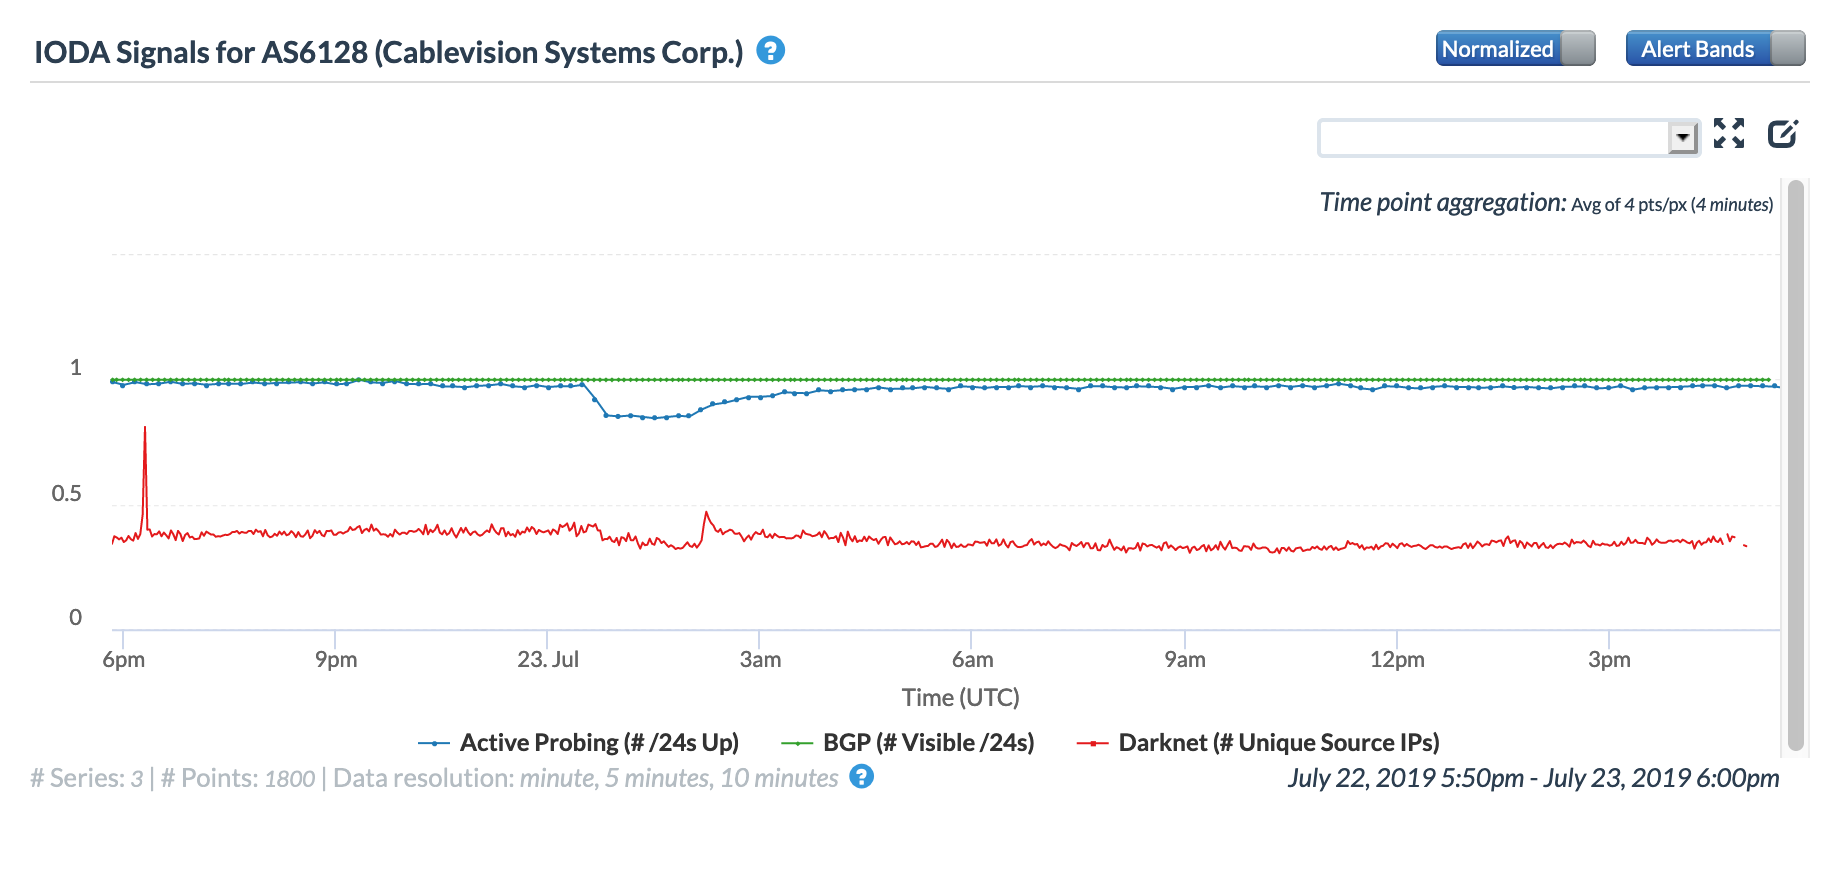
The disruption coincided with heavy rainstorms that hit the greater New York City area, and Optimum Online’s @OptimumHelp Twitter account confirmed that the observed outages were, in fact, storm-related.
On July 23, powerful storms hit several towns on Cape Cod in Massachusetts, spawning multiple tornadoes. At 12:12 (ET), a Boston-area weather forecaster Tweeted that the towns of South Brewster, East Harwich, and South Orleans were next up in the storm’s path. Just a few minutes later, Fing’s @outagedetect account Tweeted about an Internet outage impacting Comcast users in those towns. The associated detail view indicated that the disruption lasted for nearly 11 hours.
Fiber/Cable Issues
Late in the day (GMT) on July 7, the Gambia suffered a fairly significant multi-hour Internet disruption, as seen in the figure below. The BGP metric dropped to near-zero, indicating that a few of the country’s network prefixes were still being actively routed, which accounts for the continued traceroute and DNS activity.
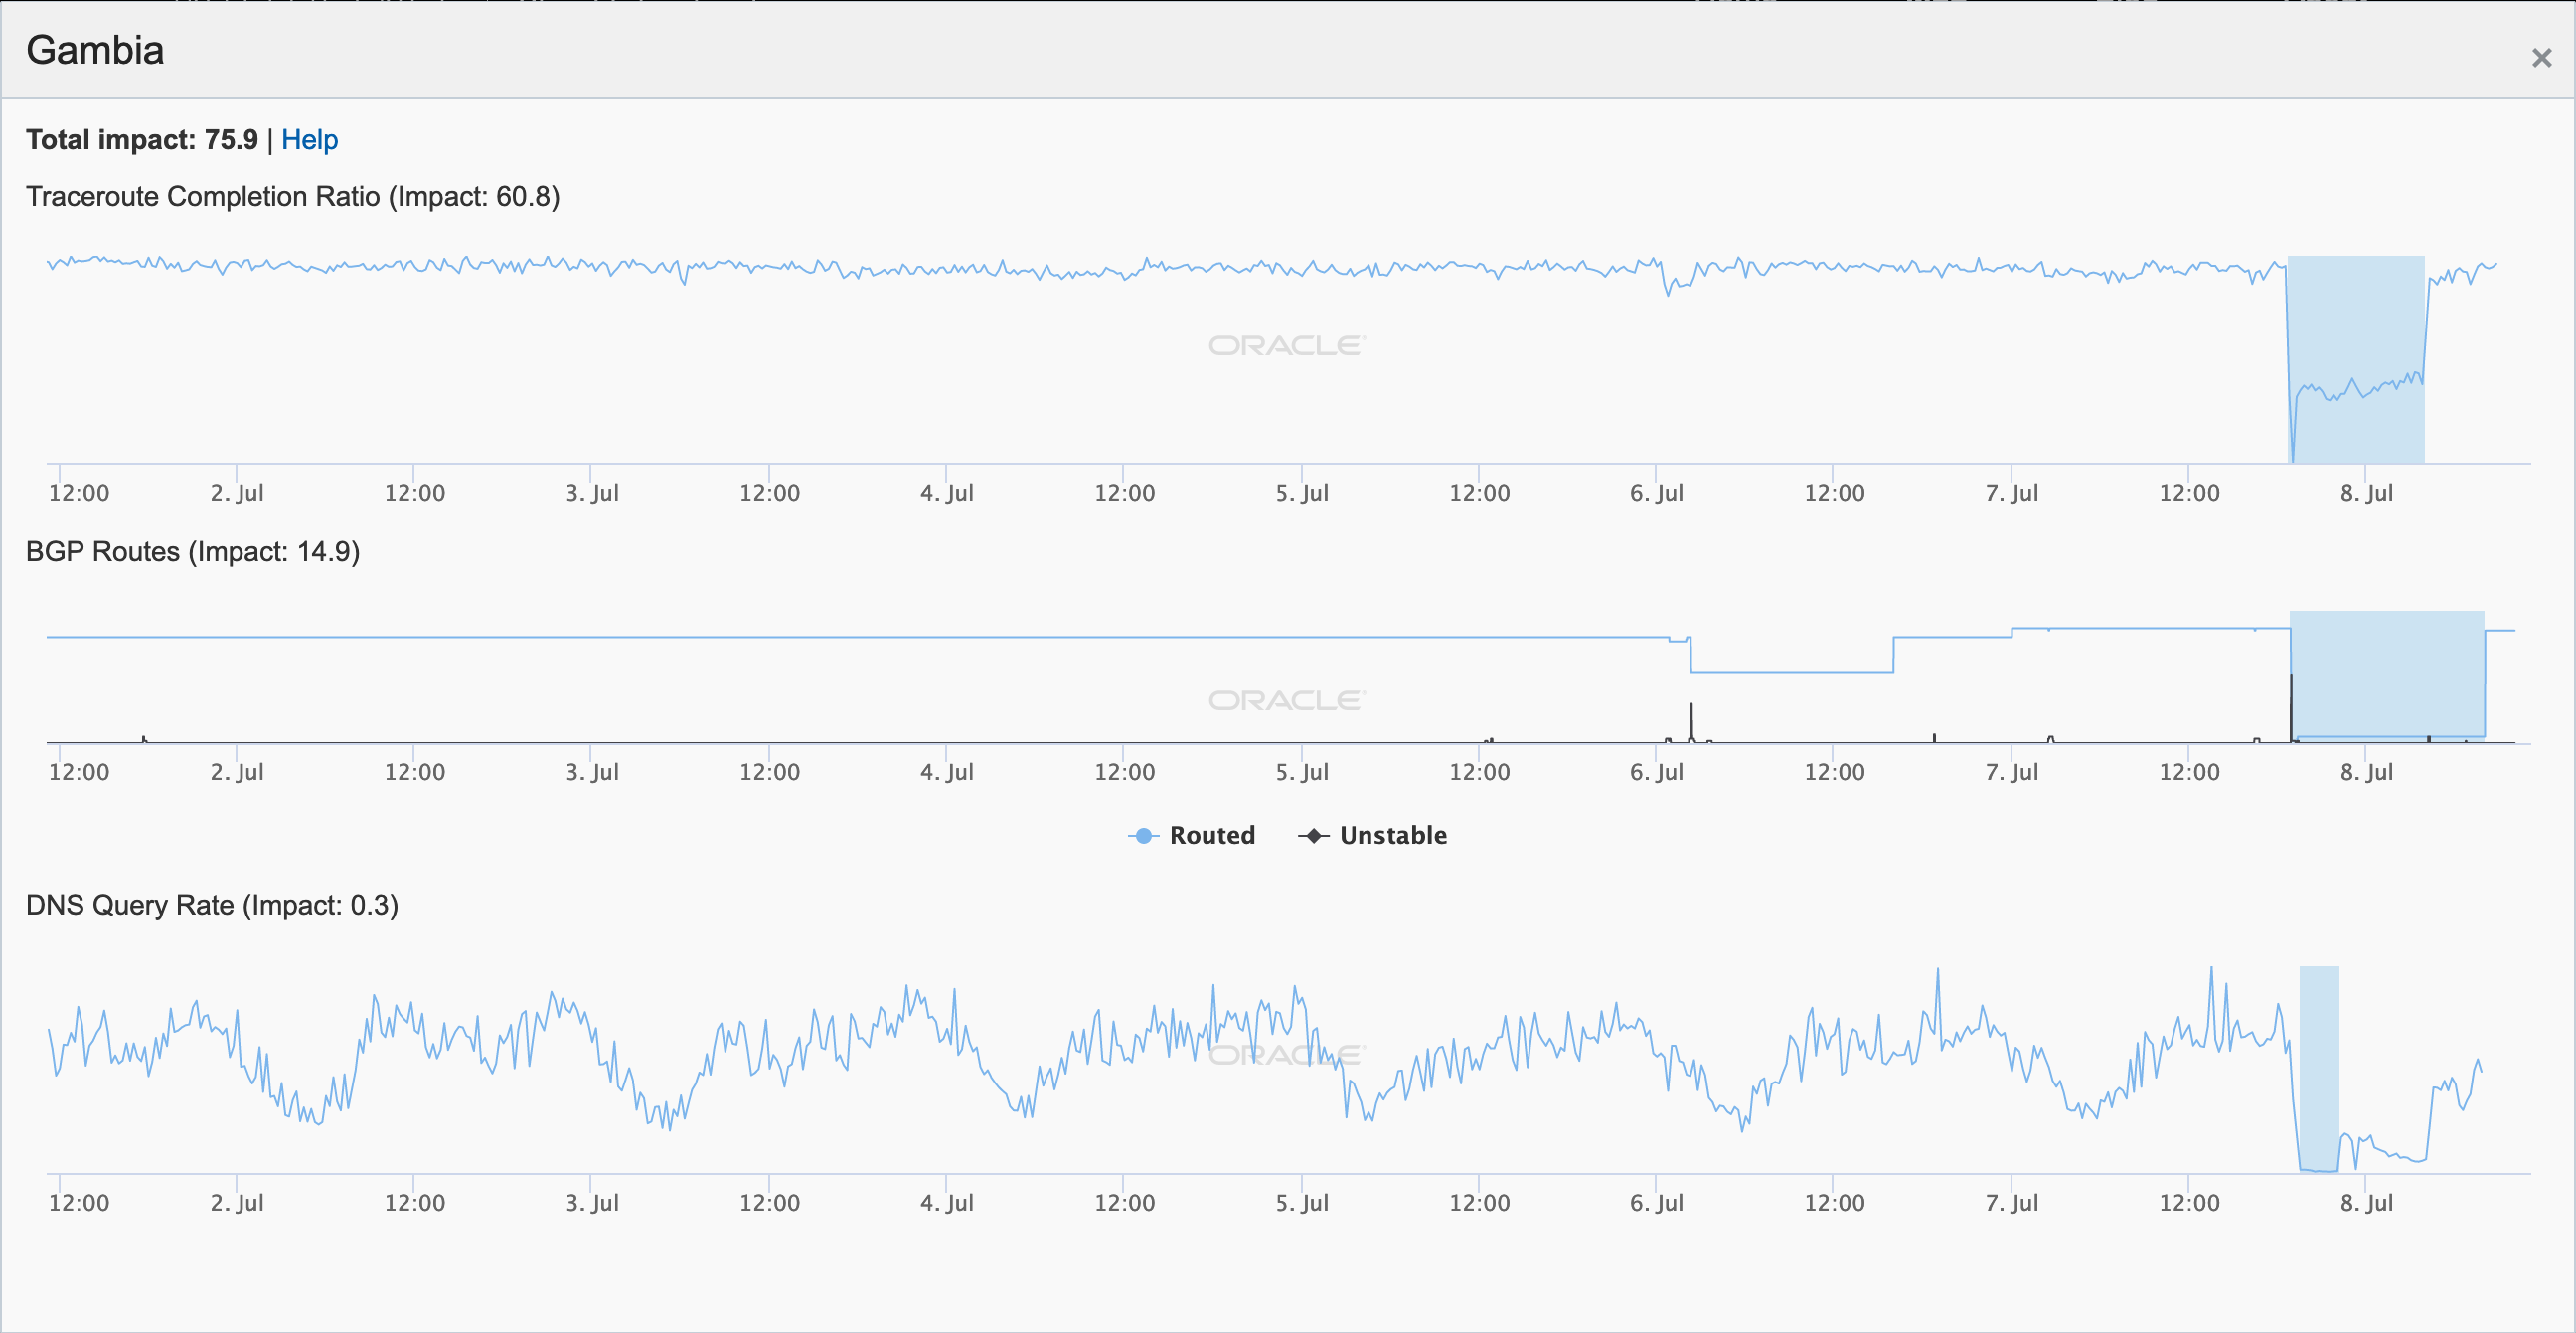
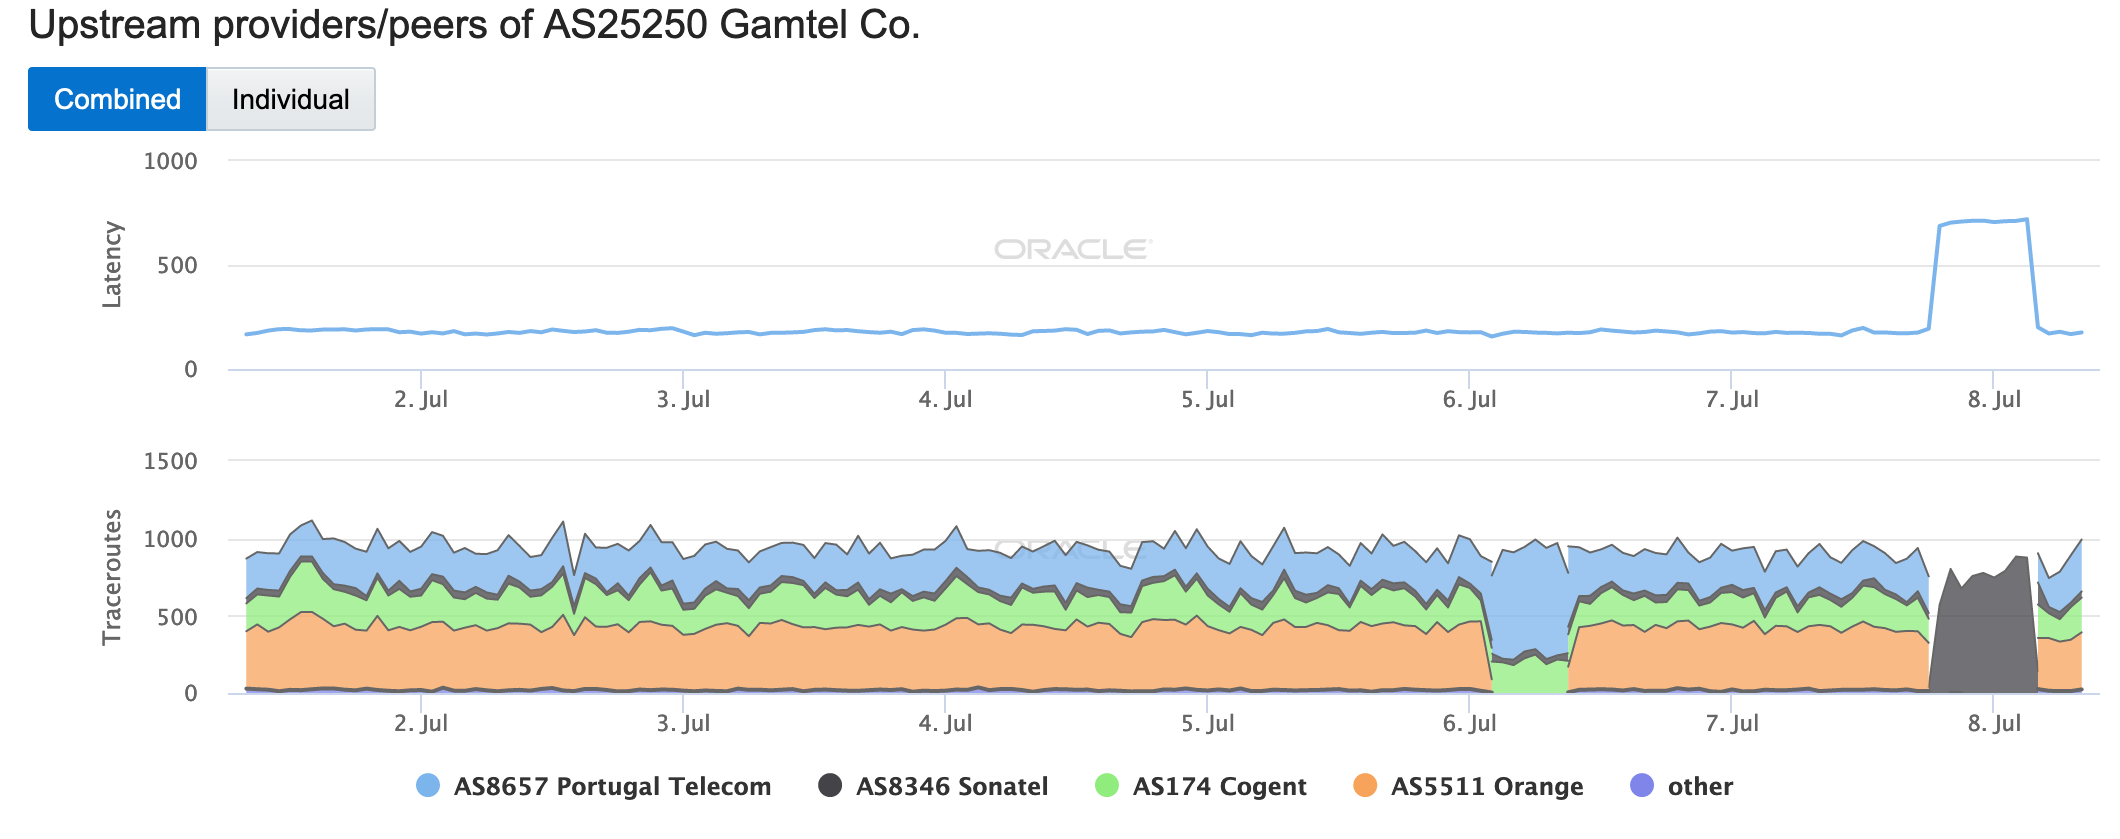
The next morning, Gambia Telecommunications Company (Gamtel) noted that the observed issue was related to technical issues at the gateway to the ACE (Africa Coast to Europe) submarine cable. While the country has other terrestrial international Internet connections, the ACE cable is its sole submarine connection. The impact to Gamtel’s Internet connectivity is shown in the figure below — latency spiked as traceroutes to endpoints within the country failed over to a connection through Sonatel, as paths through the other carriers became unavailable.
Earlier that same day, Swaziland also suffered an Internet disruption, as seen in the figure below. Although the traceroute and BGP metrics only showed a slight decline, the DNS query rate dropped significantly.
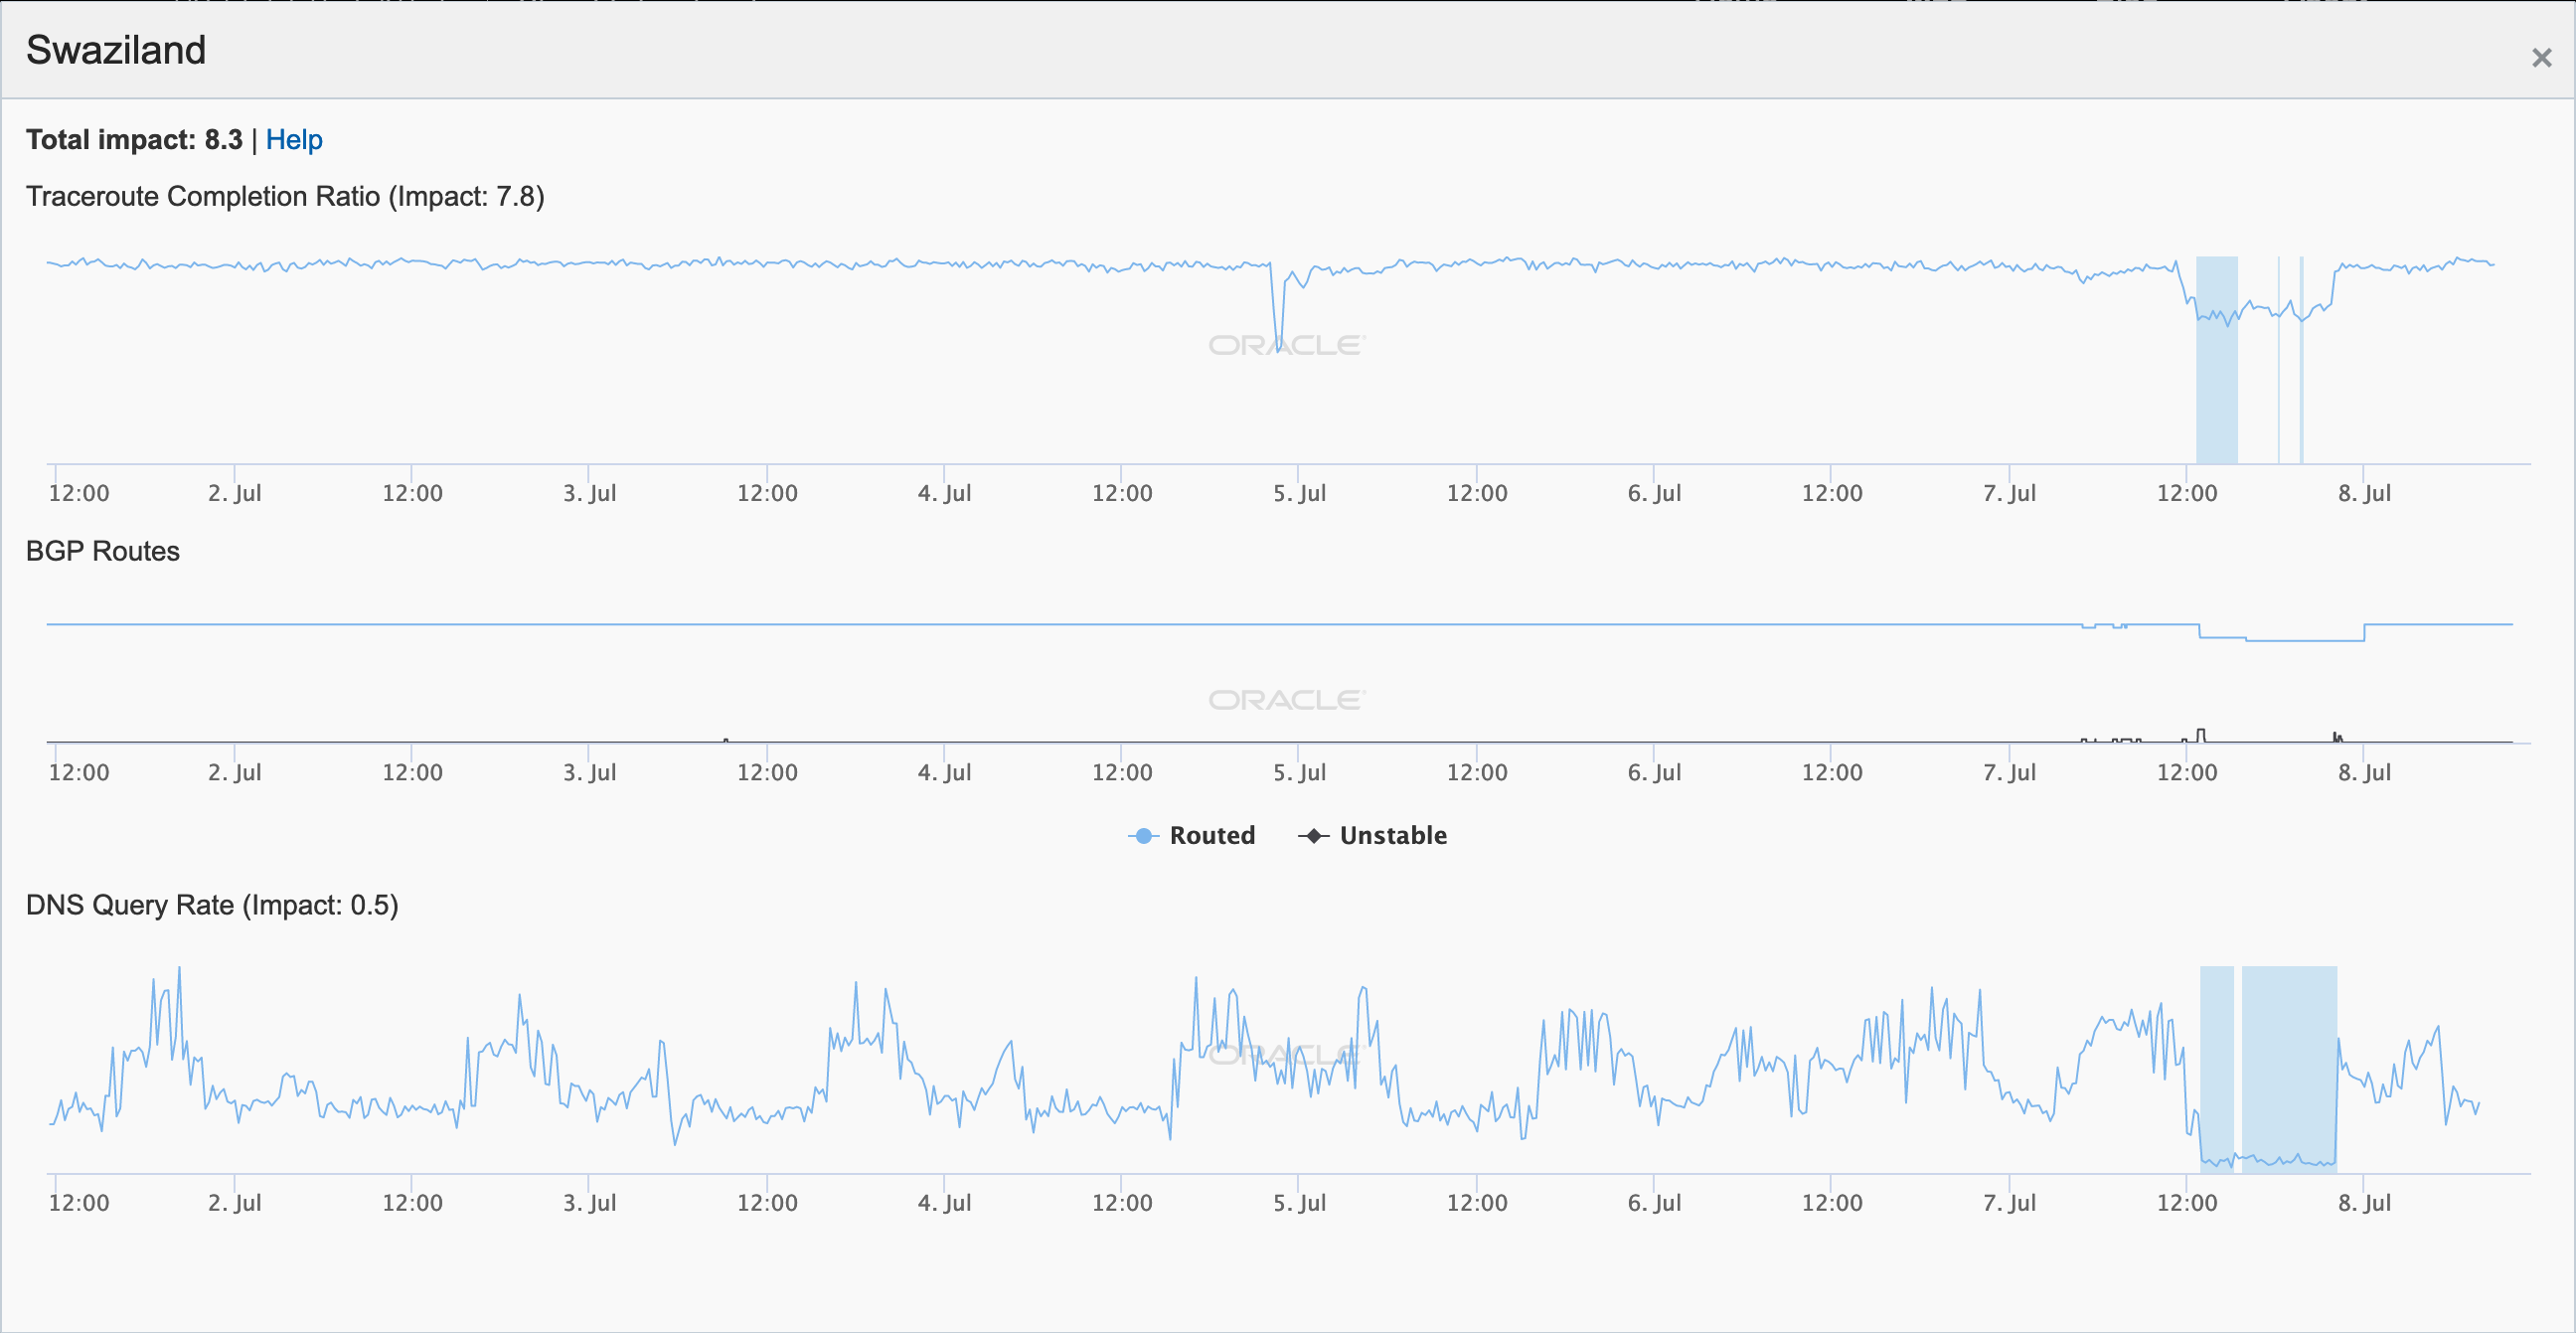
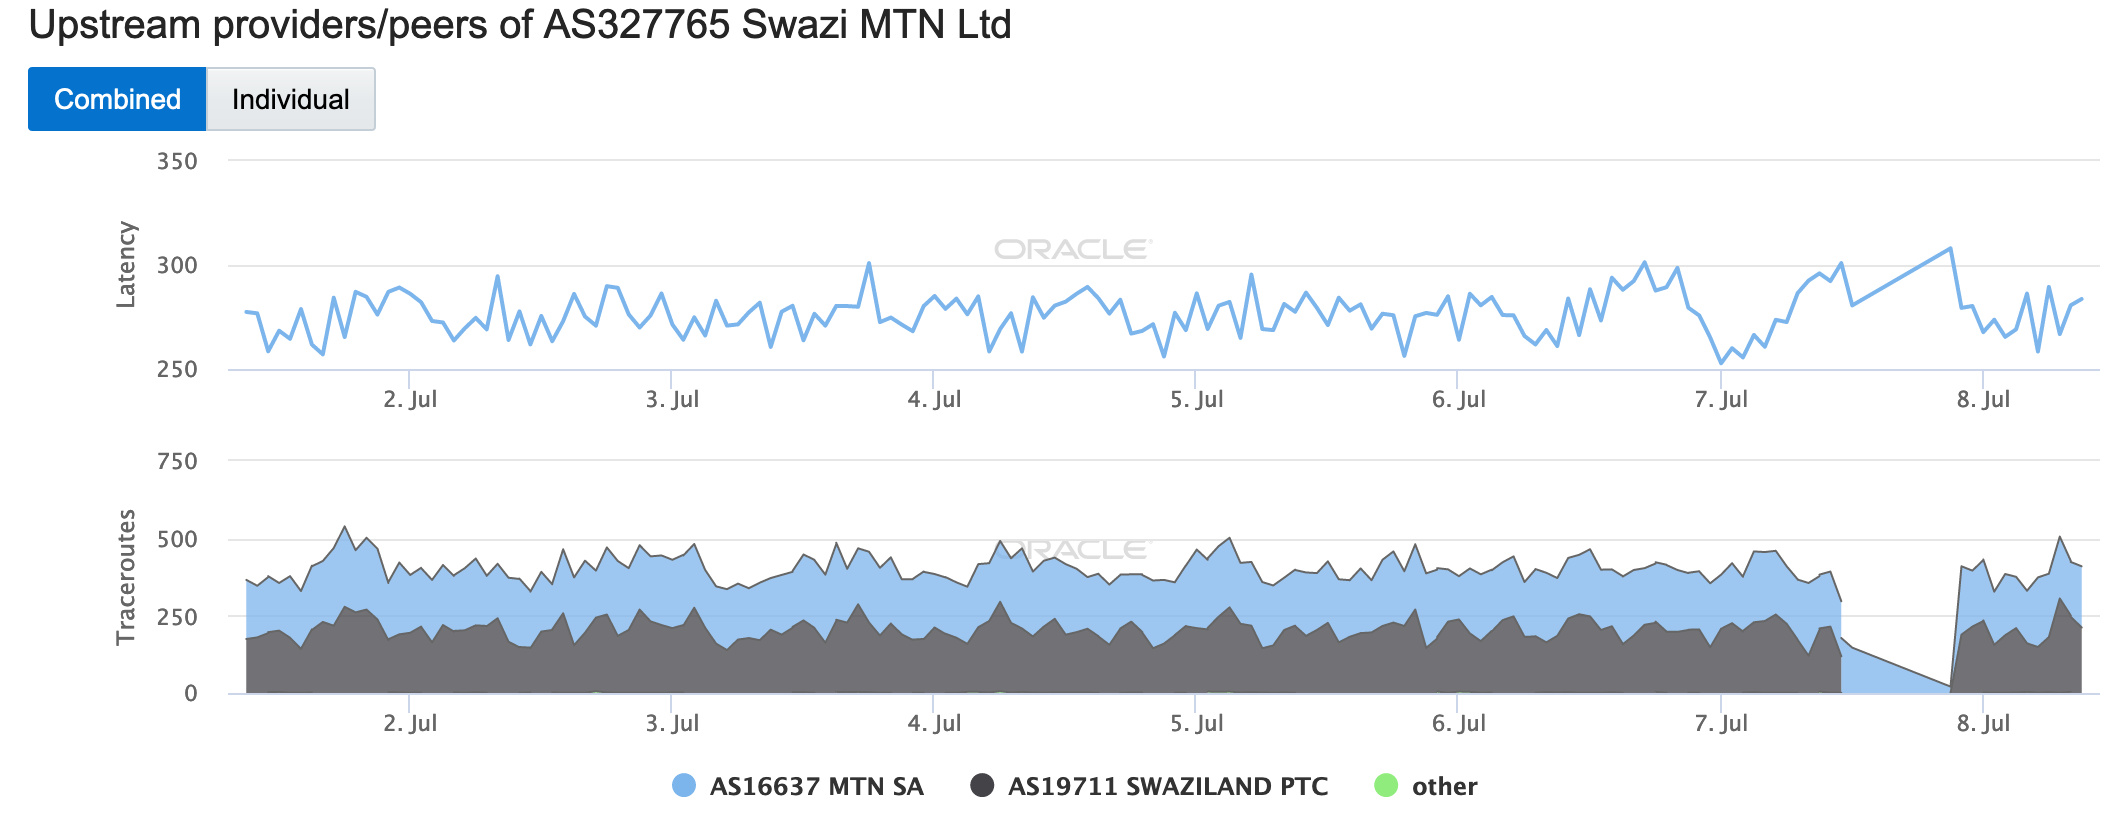
A significant disruption was observed at the same time at AS327765 (Swazi MTN), a Swazi telecommunications company. The figure below shows that during the disruptions, traceroutes to endpoints within the network completely stop transiting AS19711 (Swaziland PTC). The next day, @MTNSwaziland Tweeted an apology for the prior day’s disruption, noting that it was due to a fiber optic “breakdown” at Eswatini Post & Telecom Corporation – the same network noted above. (Swaziland was renamed “the Kingdom of eSwatini” in 2018.)
Unattributed Causes
In the Internet disruptions reviewed above, the root causes were discoverable thanks to news coverage of an associated event or a social media post by an impacted network service provider. However, there were a number of other disruptions observed across multiple countries in July where the root causes were unknown – no associated social media posts from impacted providers or known local events that could have had a significant impact to Internet connectivity. In addition, for many of these disruptions, the affected service providers did not respond to outreach on social media, including Twitter and Facebook.
United Kingdom
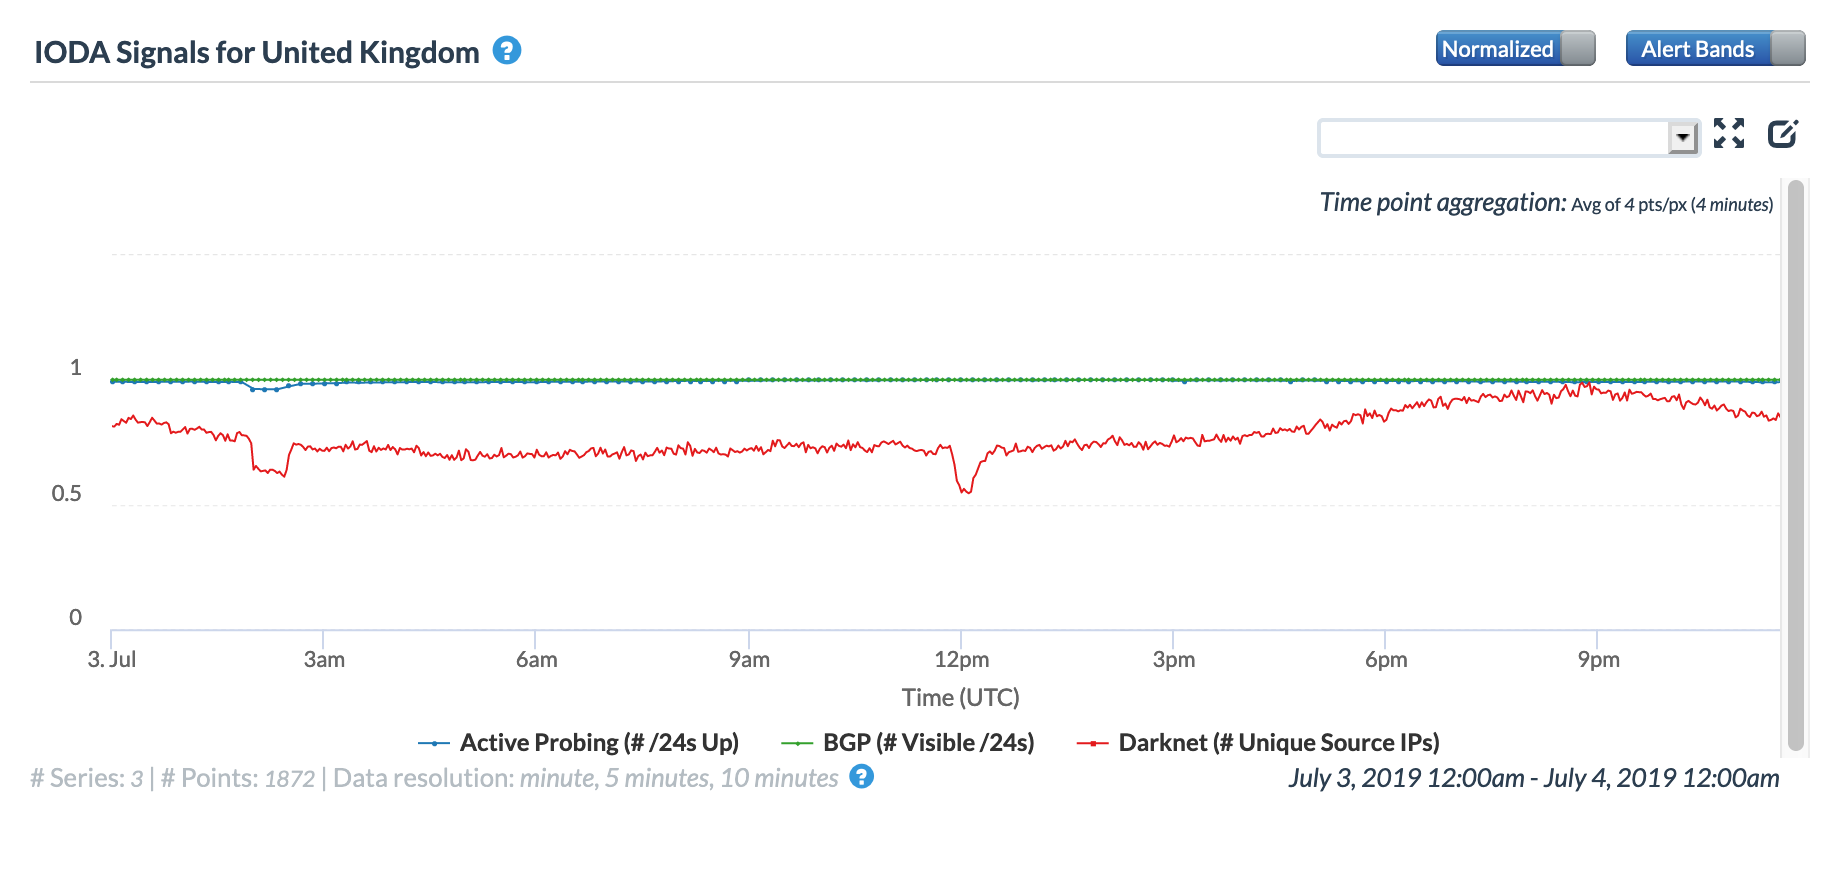
CAIDA IODA graph for United Kingdom, July 3 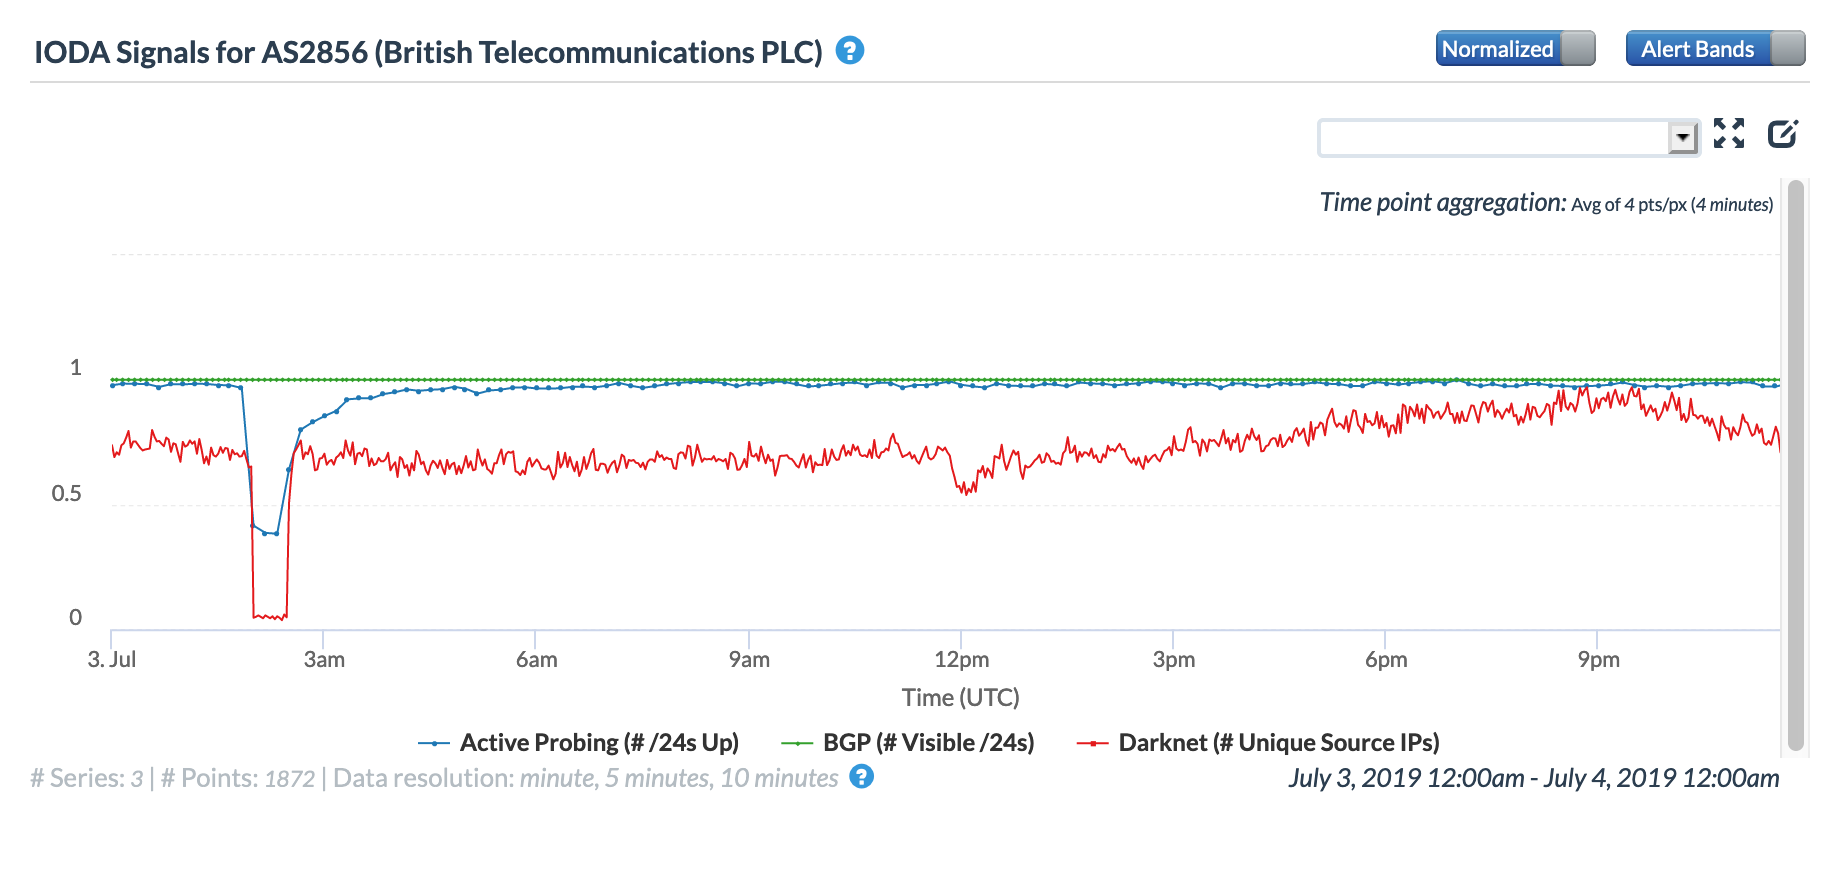
CAIDA IODA graph for AS2856 (BT), July 3
The Gambia
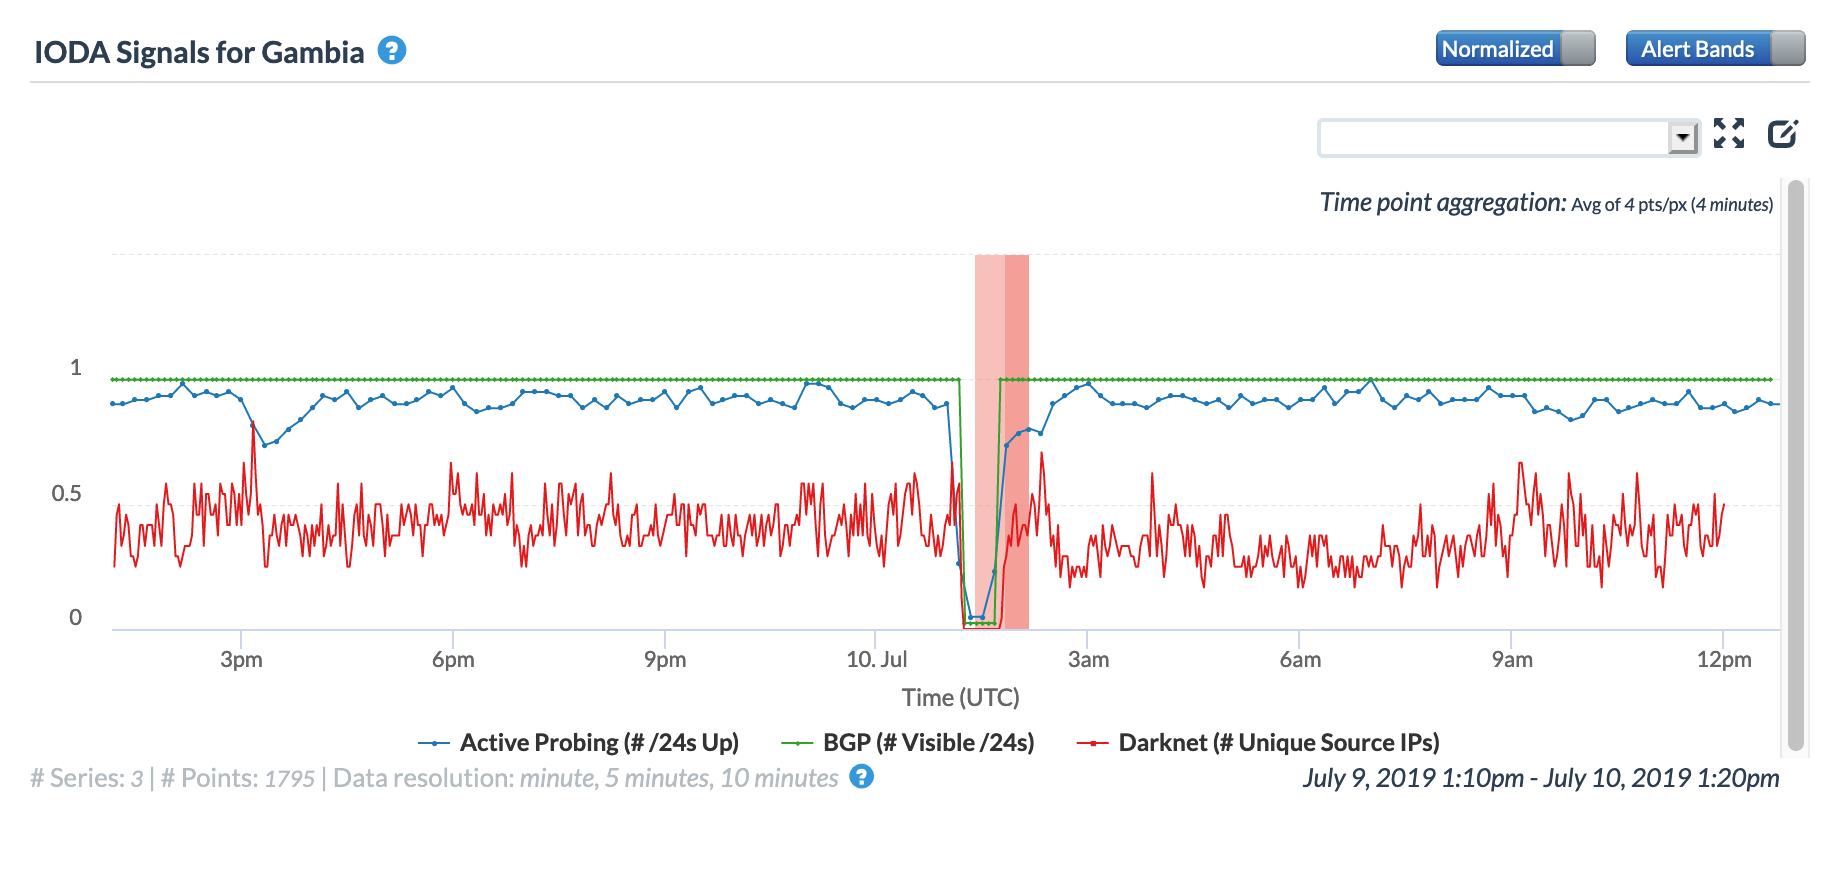
CAIDA IODA graph for Gambia, July 10 
CAIDA IODA graph for AS25250 (Gamtel), July 10
Togo
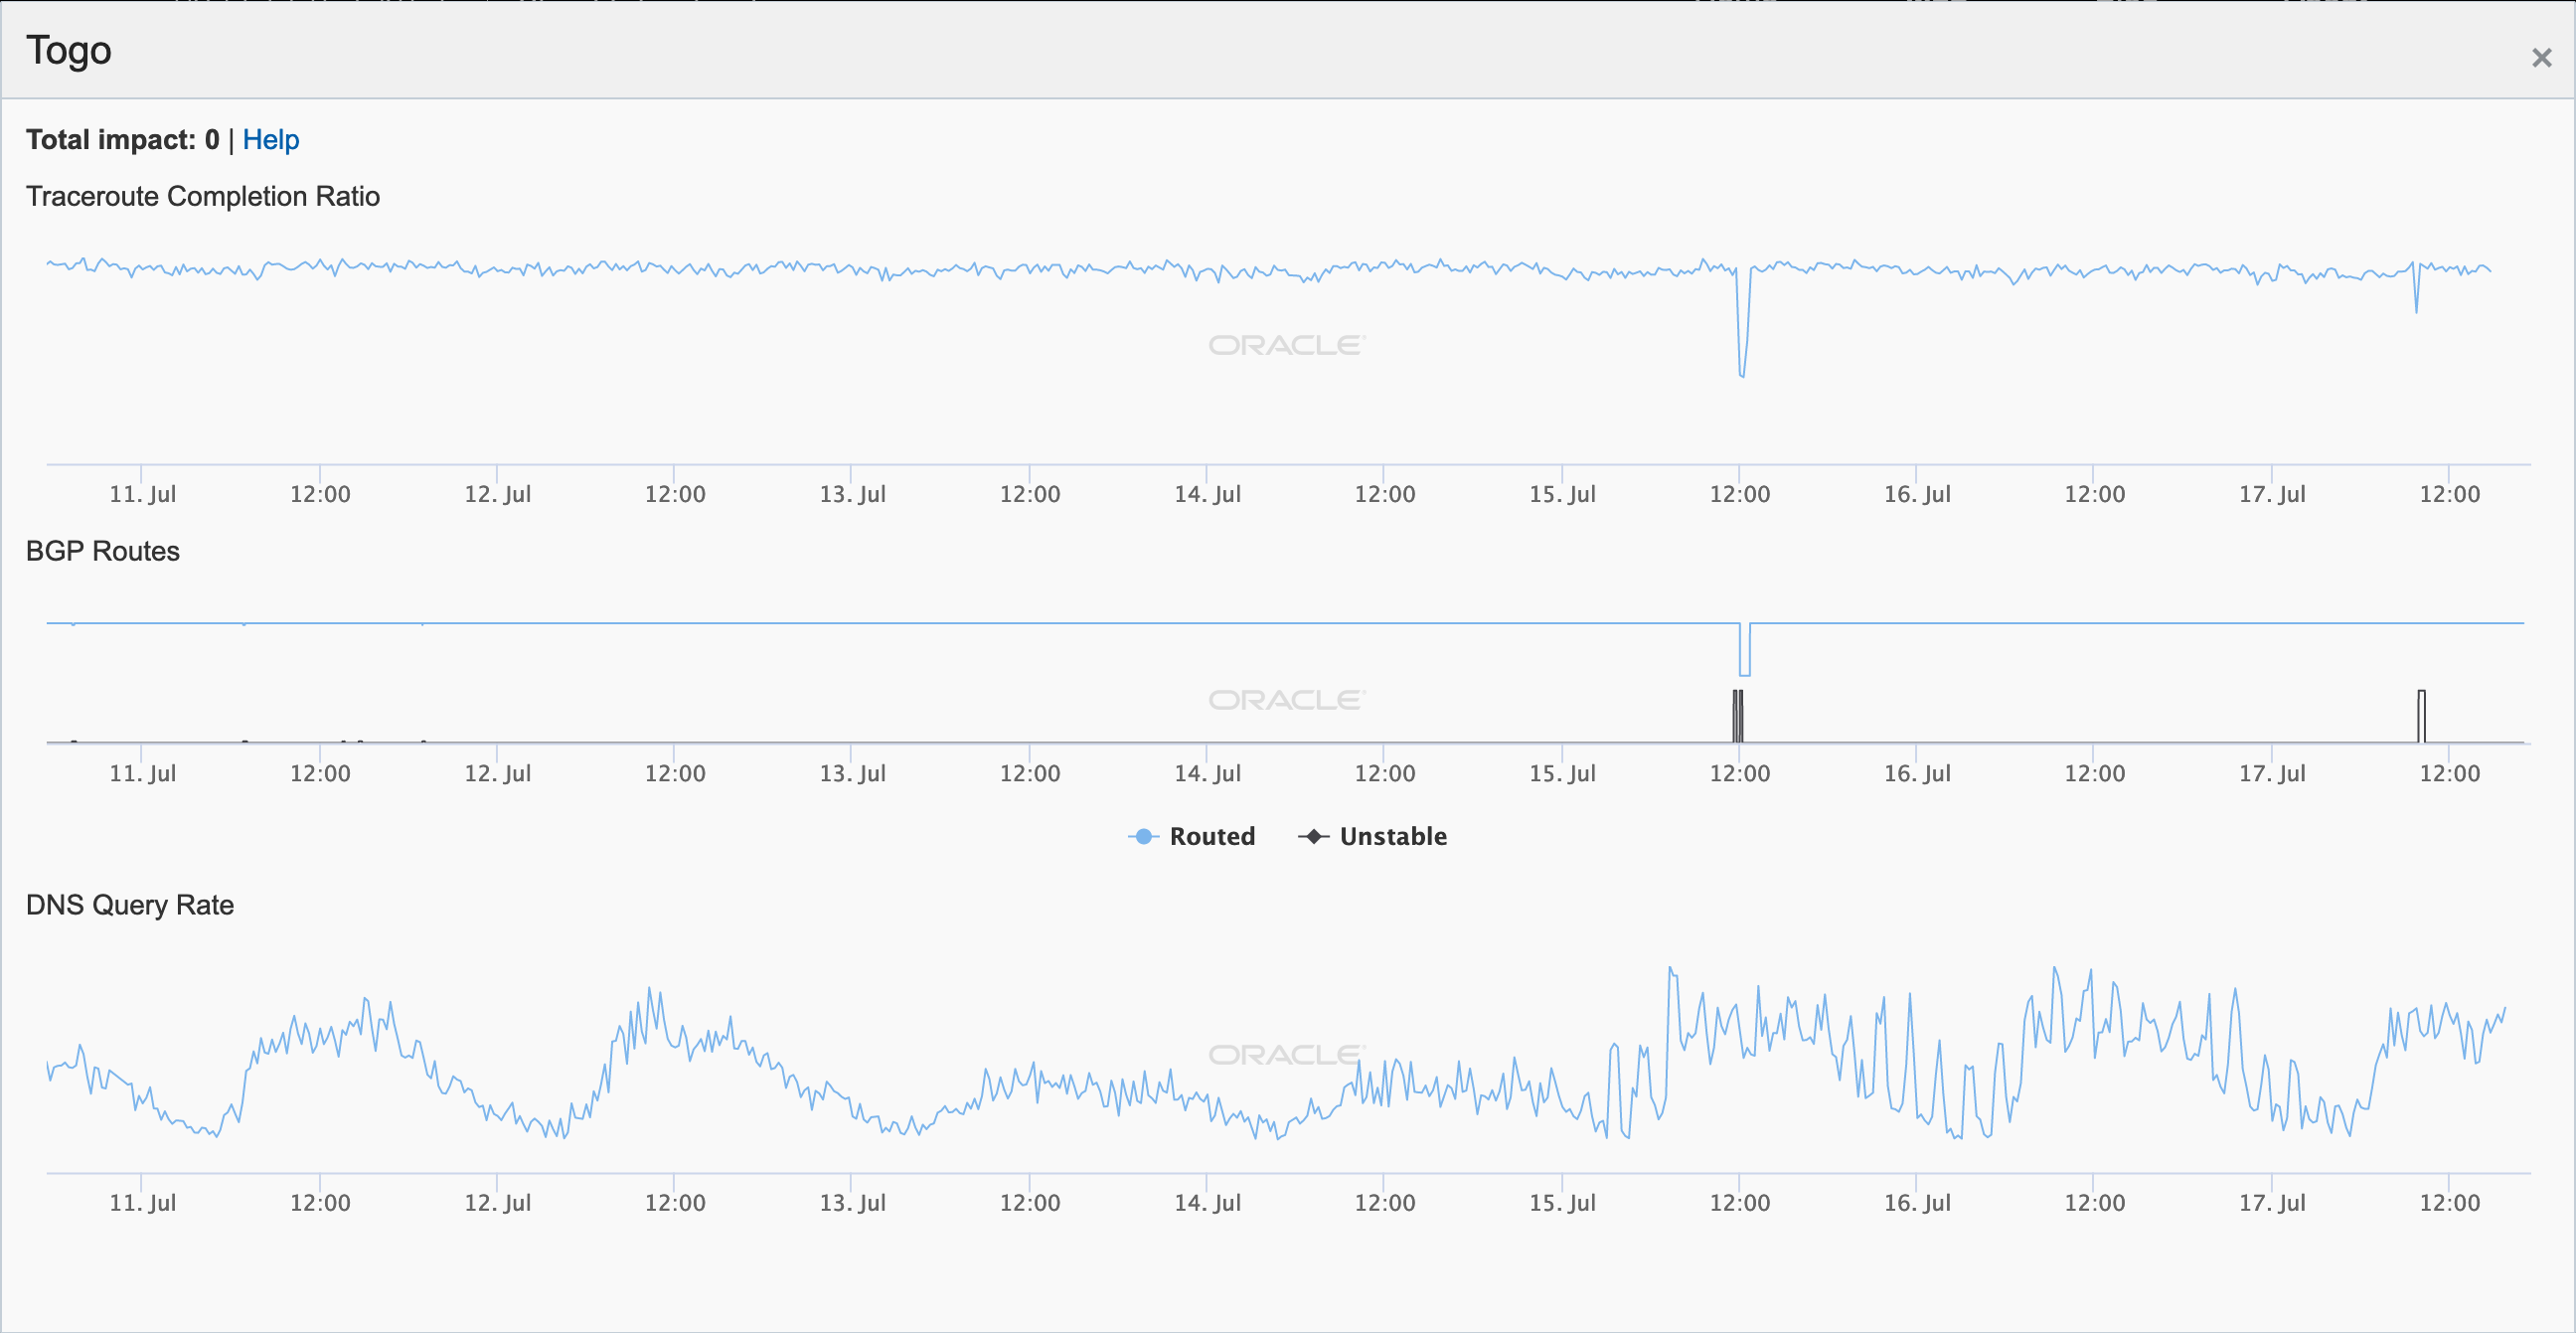
Oracle Internet Intelligence graph for Togo, July 10-17 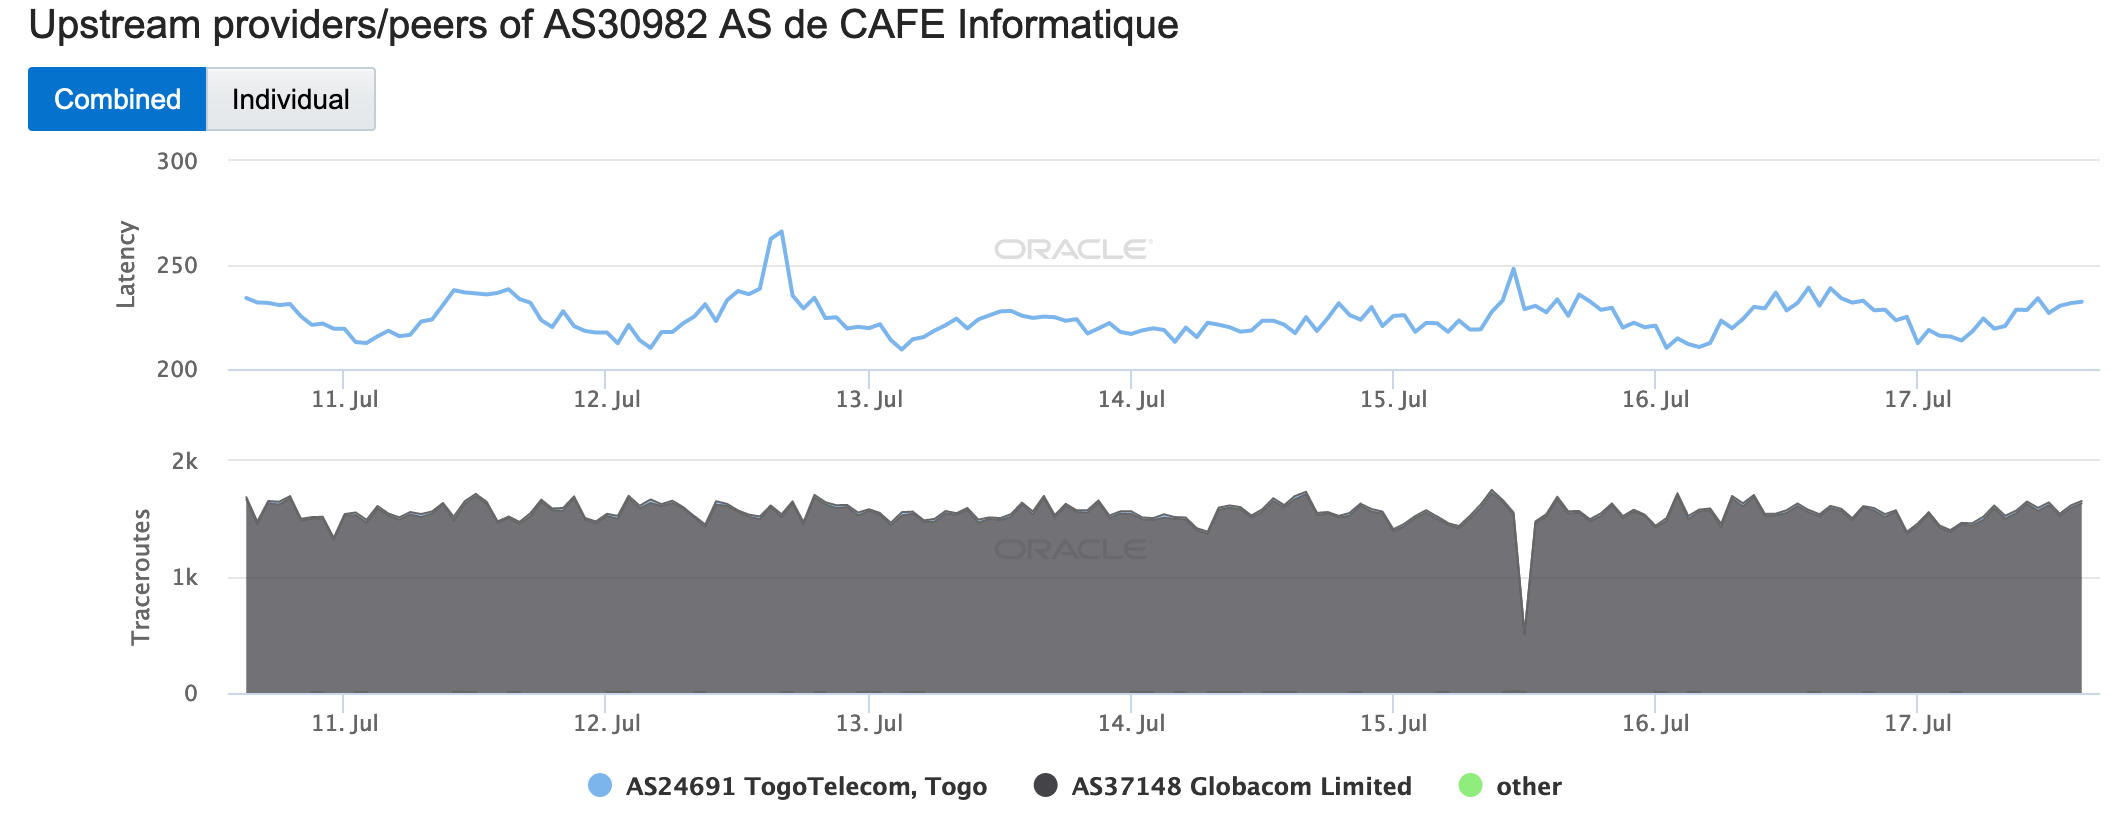
Oracle Internet Intelligence graph for AS30982 (Cafe Informatique), July 10-17 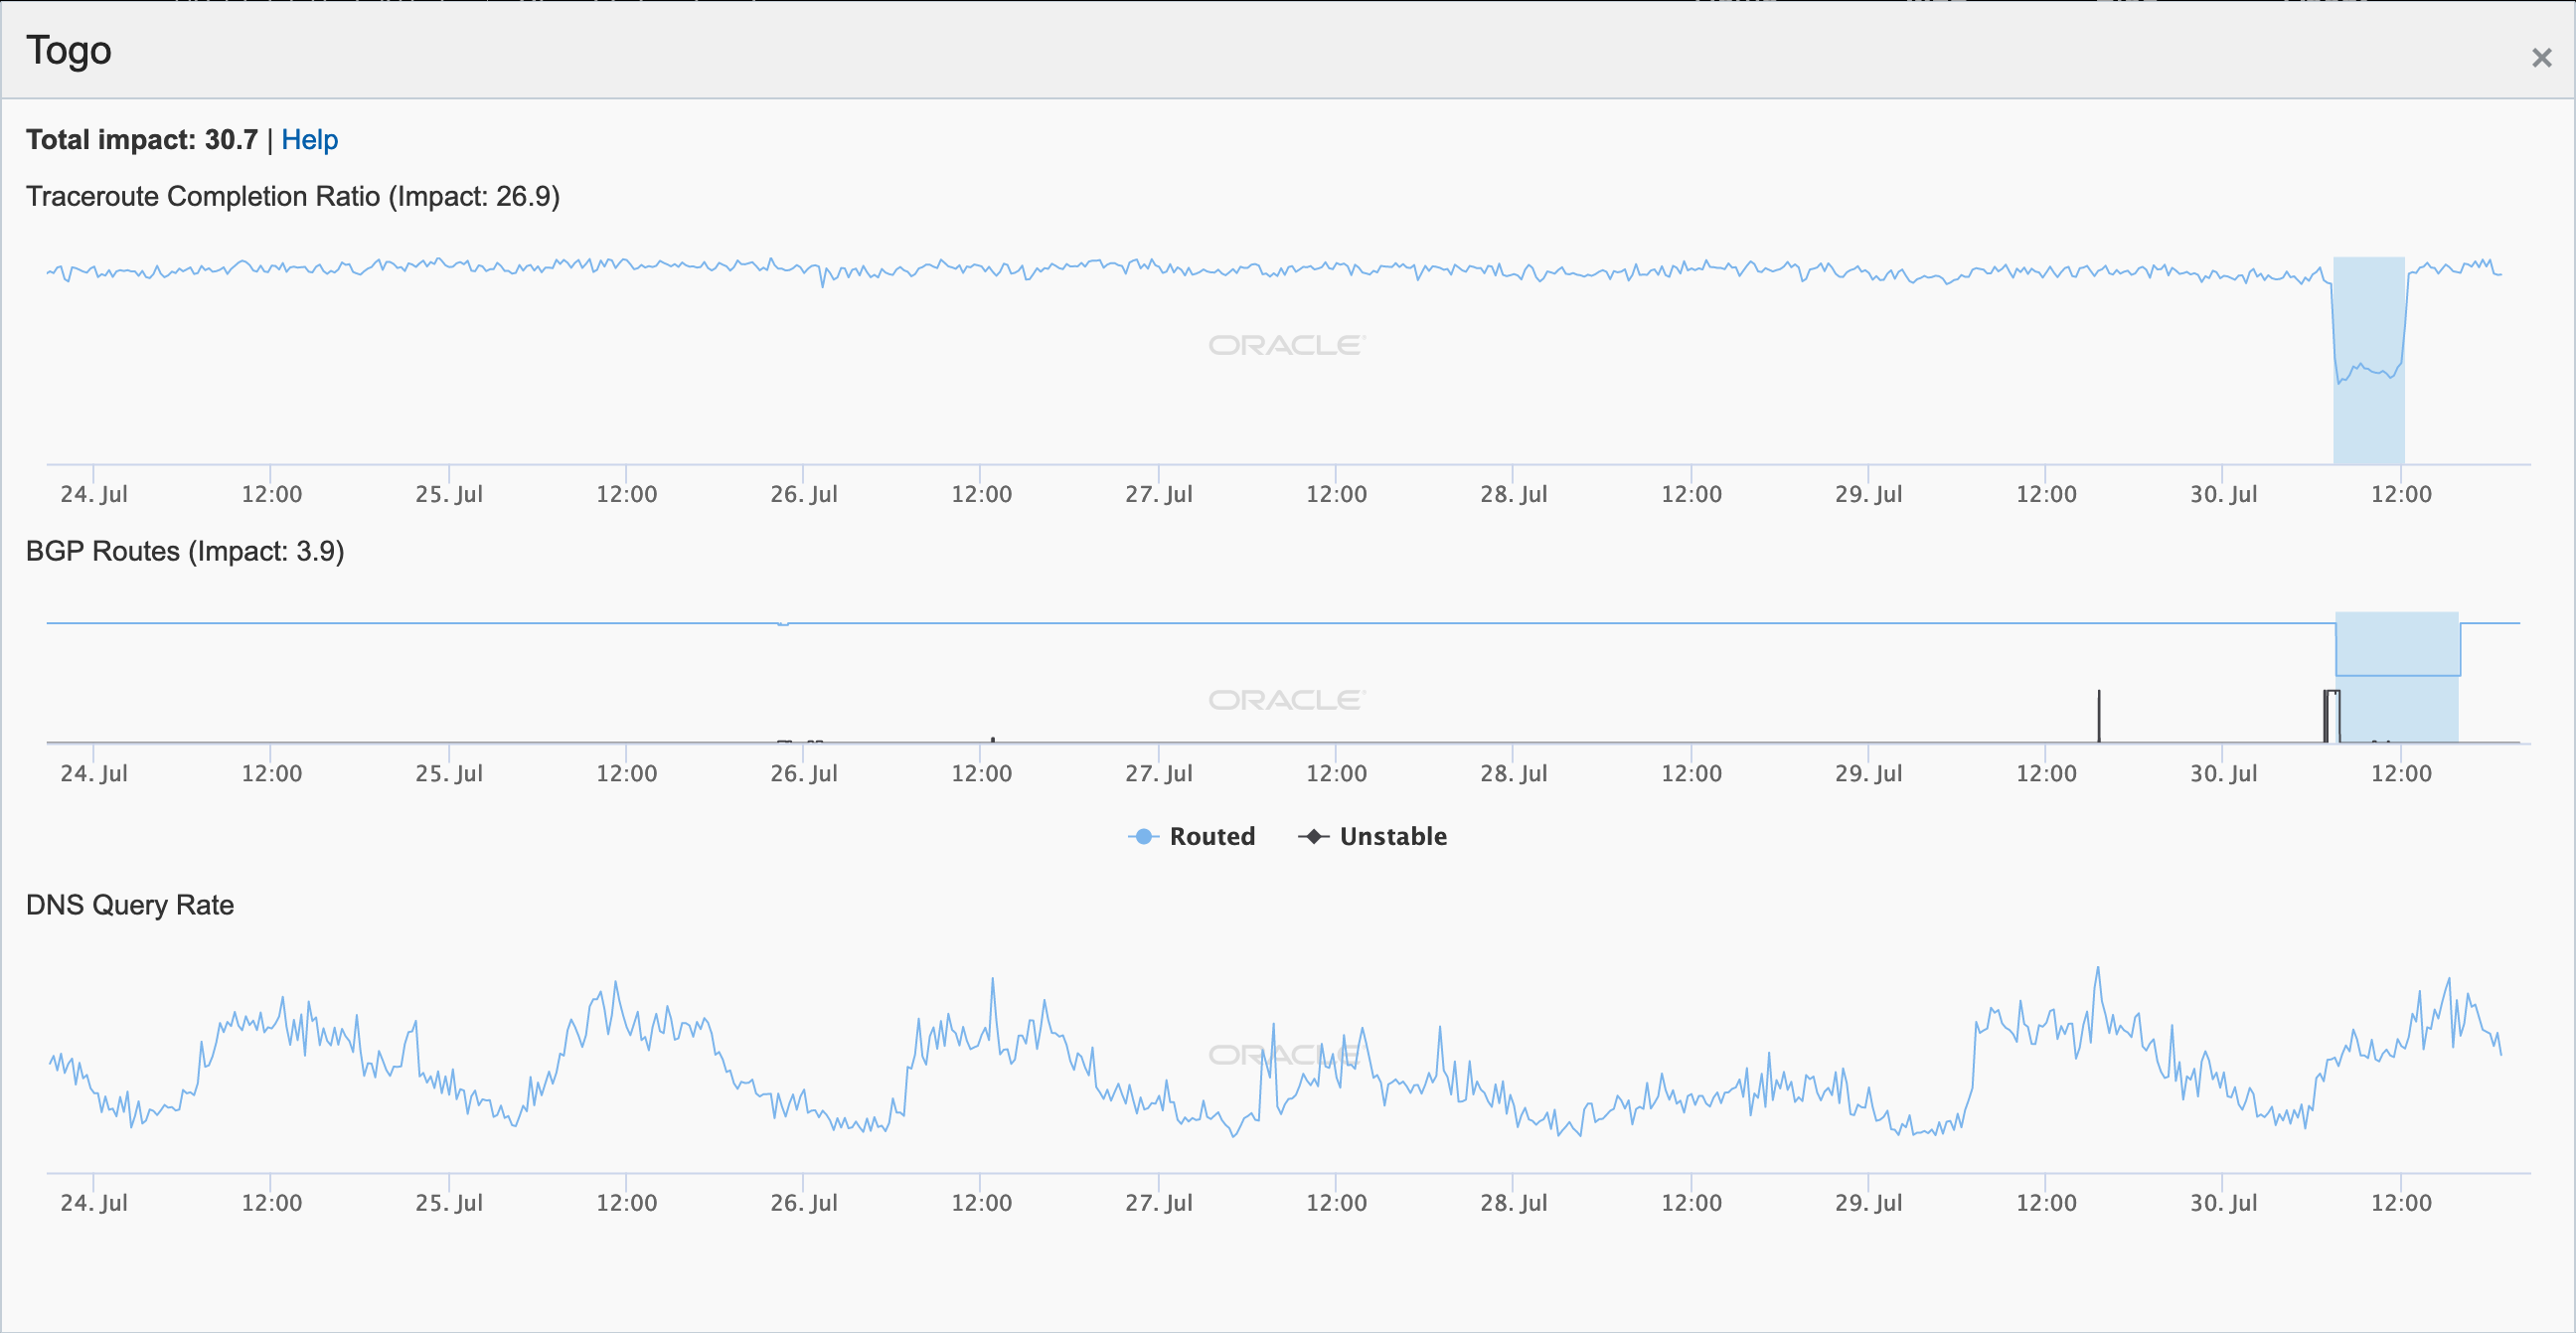
Oracle Internet Intelligence graph for Togo, July 23-30 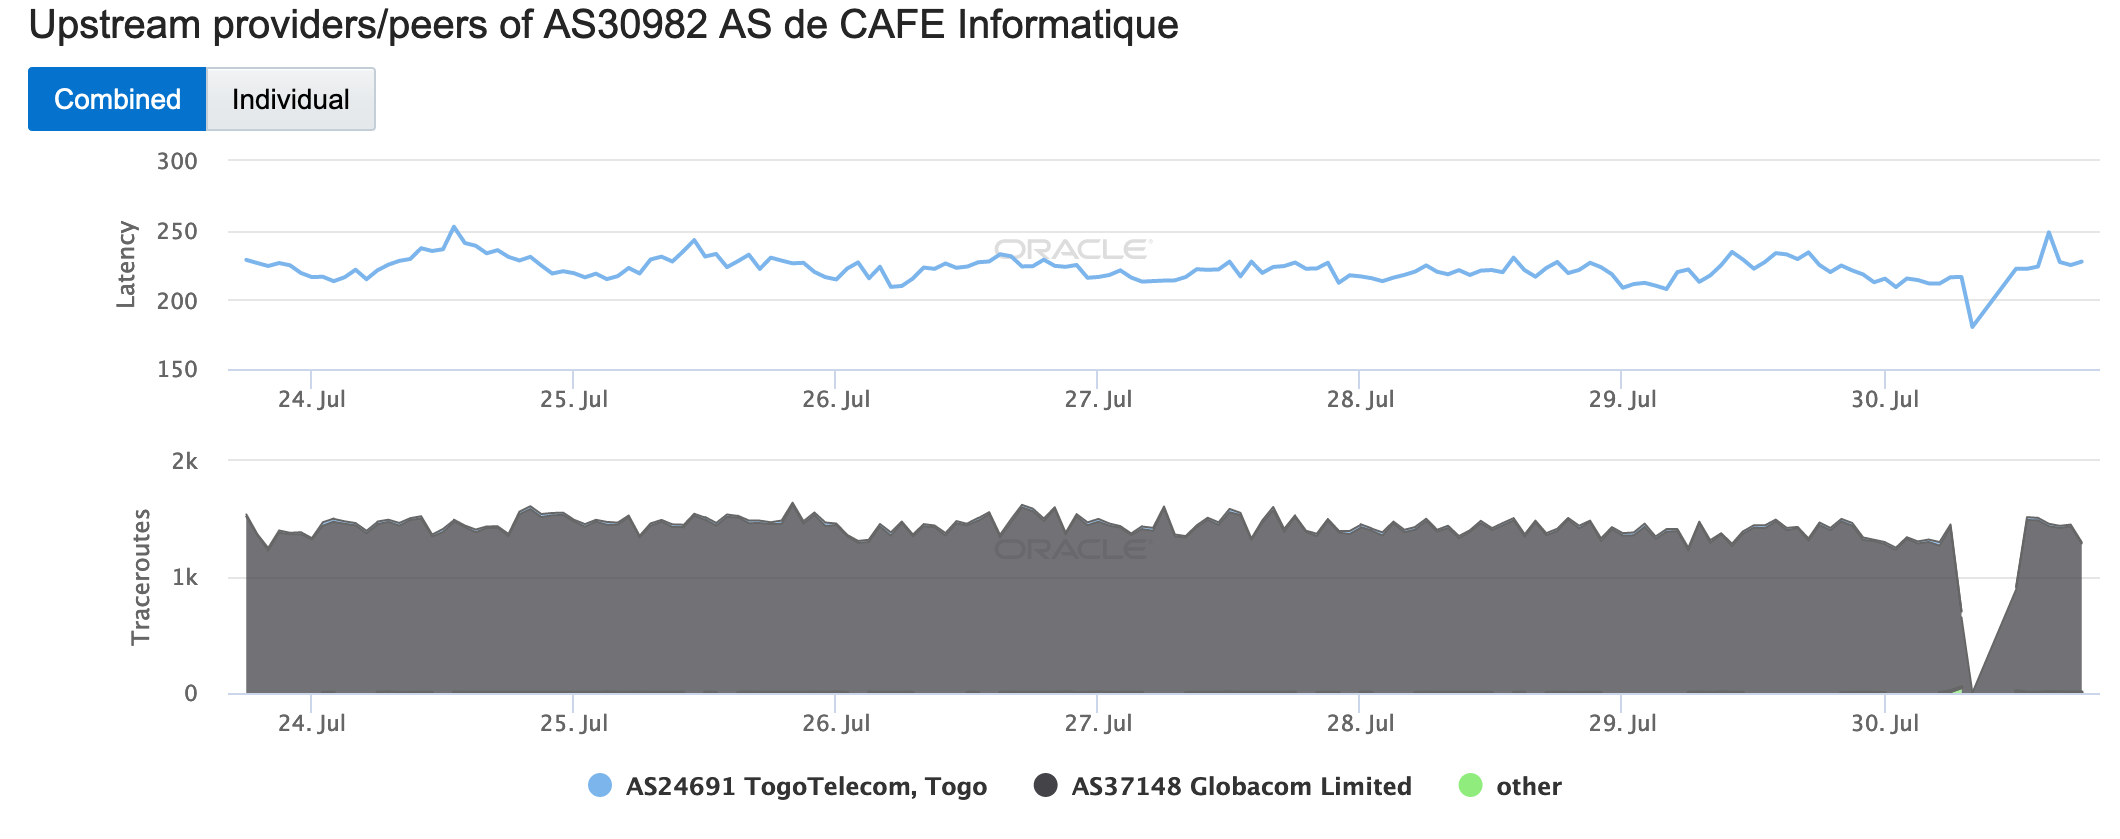
Oracle Internet Intelligence graph for AS30982 (Cafe Informatique), July 23-30
Congo
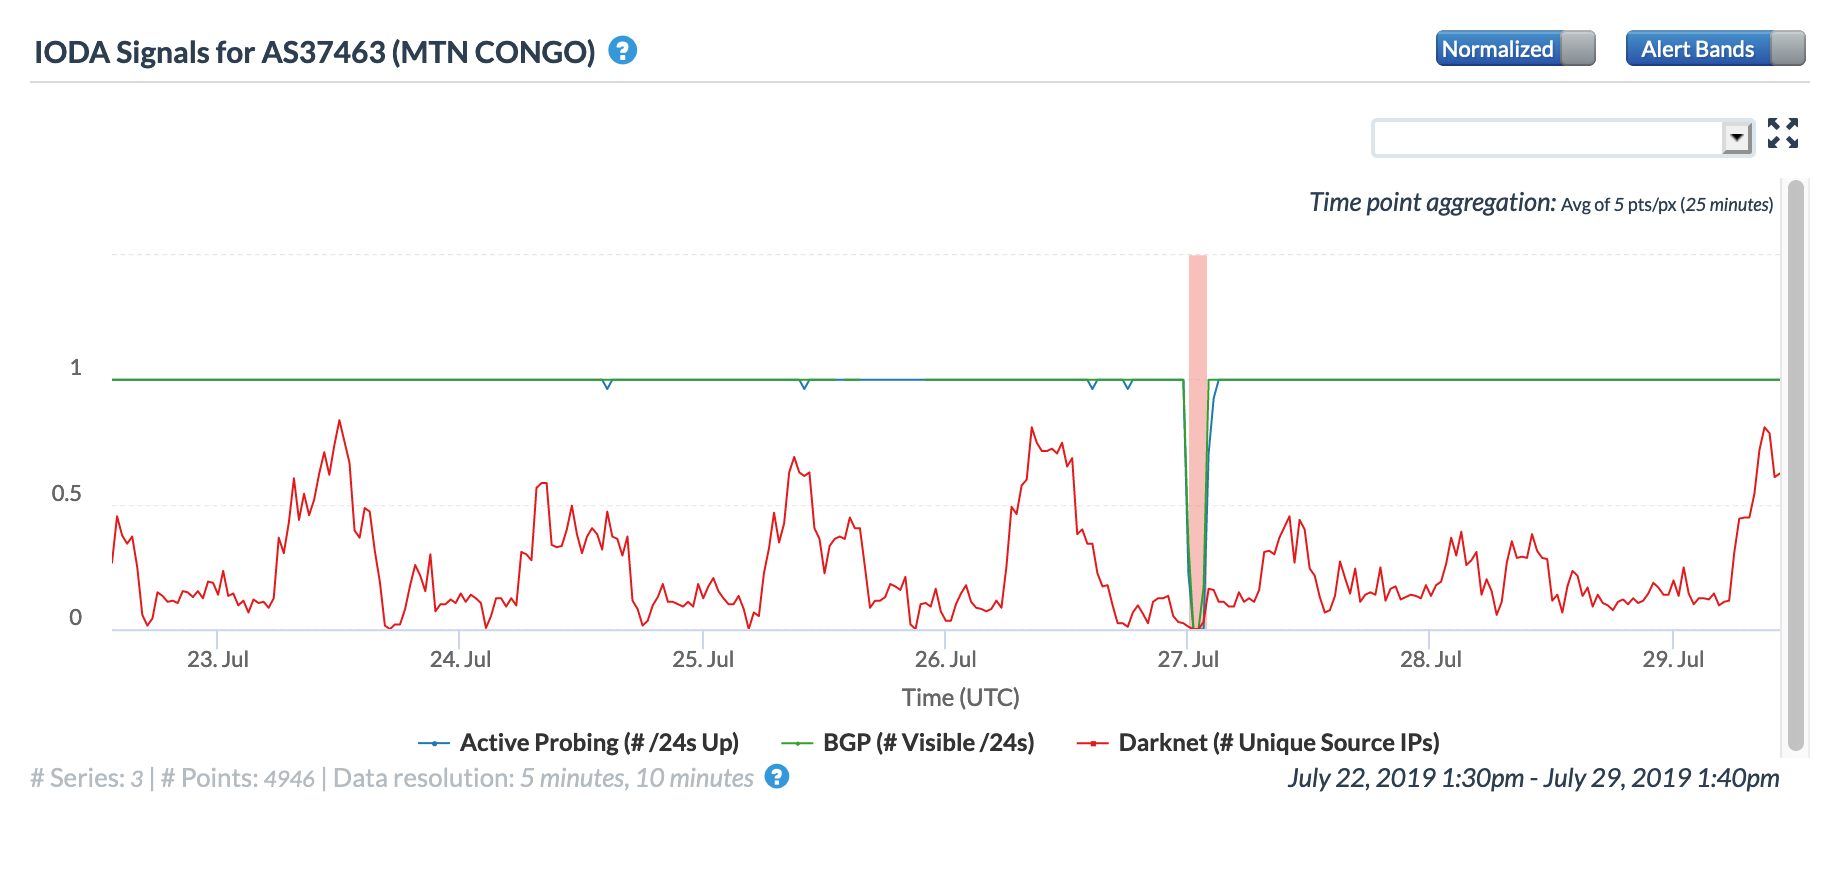
CAIDA IODA graph for AS37643 (MTN Congo), July 27 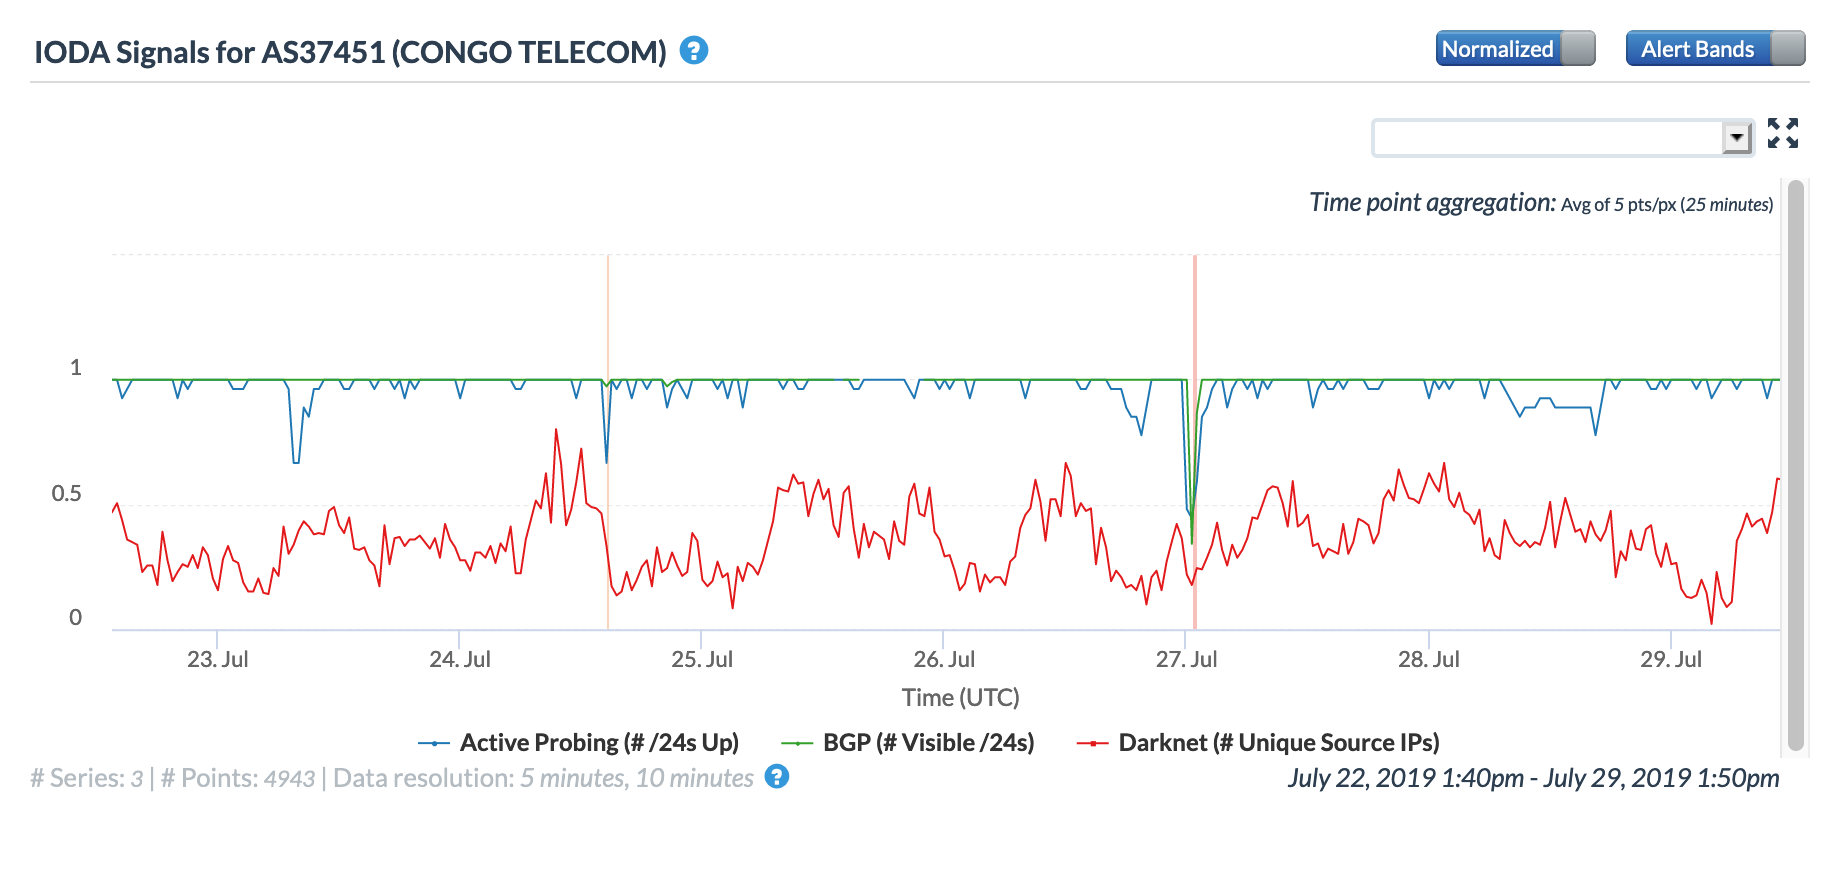
CAIDA IODA graph for AS37451 (Congo Telecom), July 27 
CAIDA IODA graph for AS37281 (OFIS-Computers), July 27 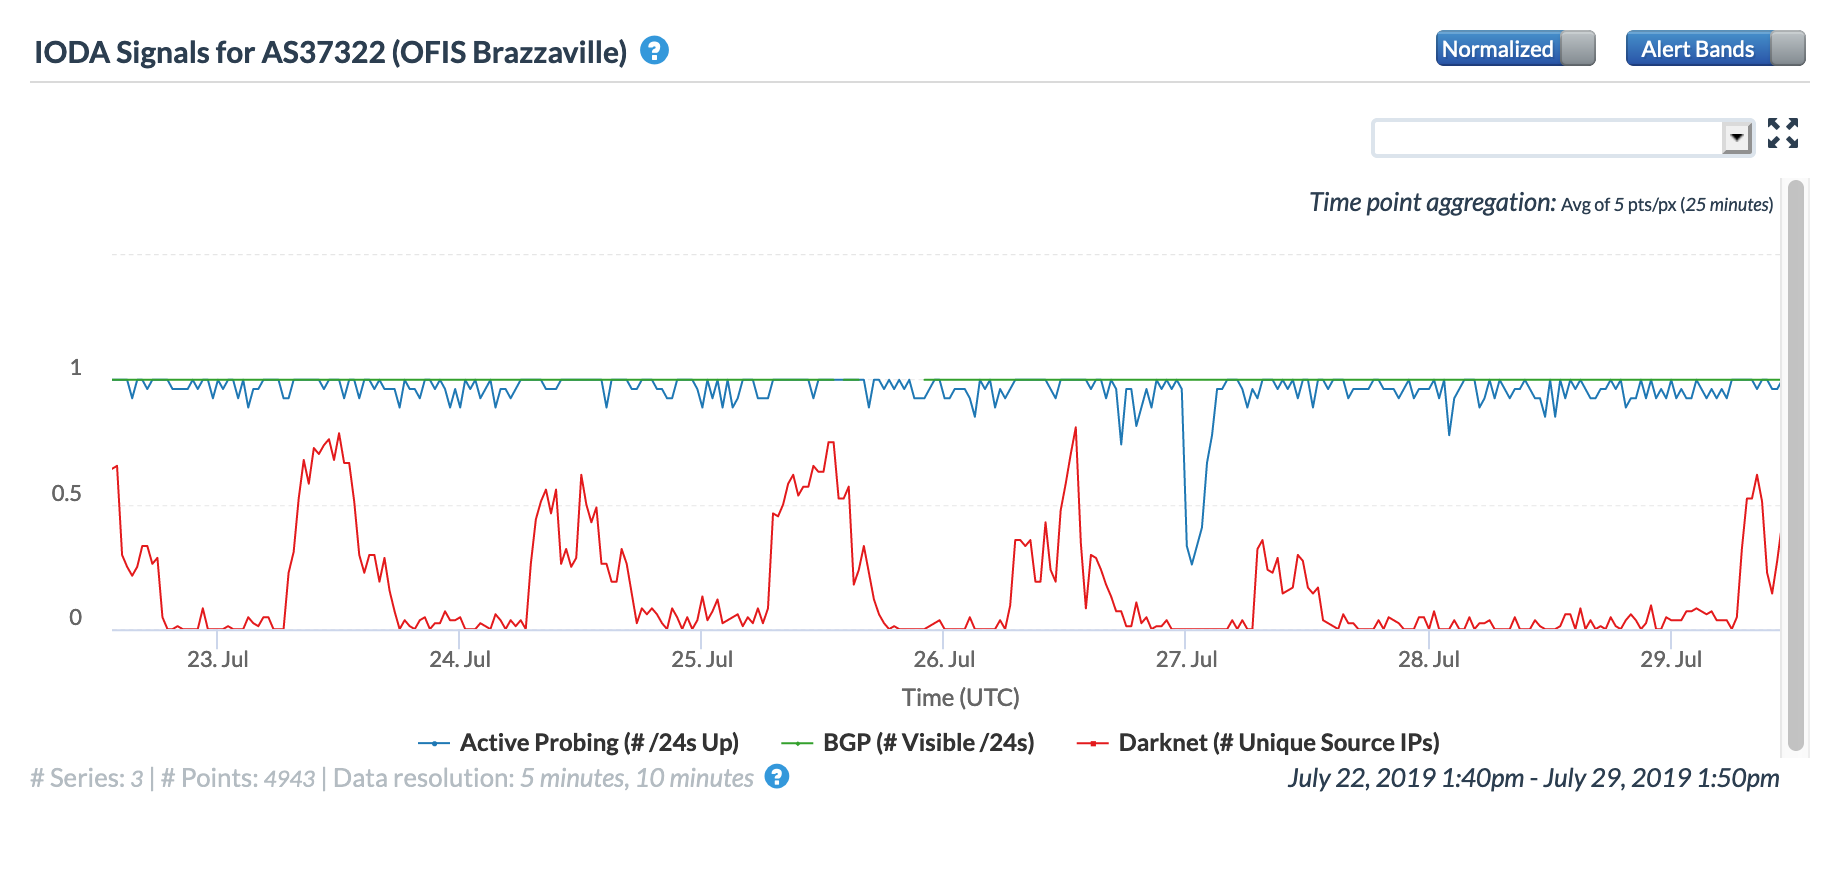
CAIDA IODA graph for AS37322 (OFIS Brazzaville), July 27
Gabon

CAIDA IODA graph for Gabon, July 29 
CAIDA IODA graph for AS16058 (Gabon Telecom), July 29
Saint Barthelemy
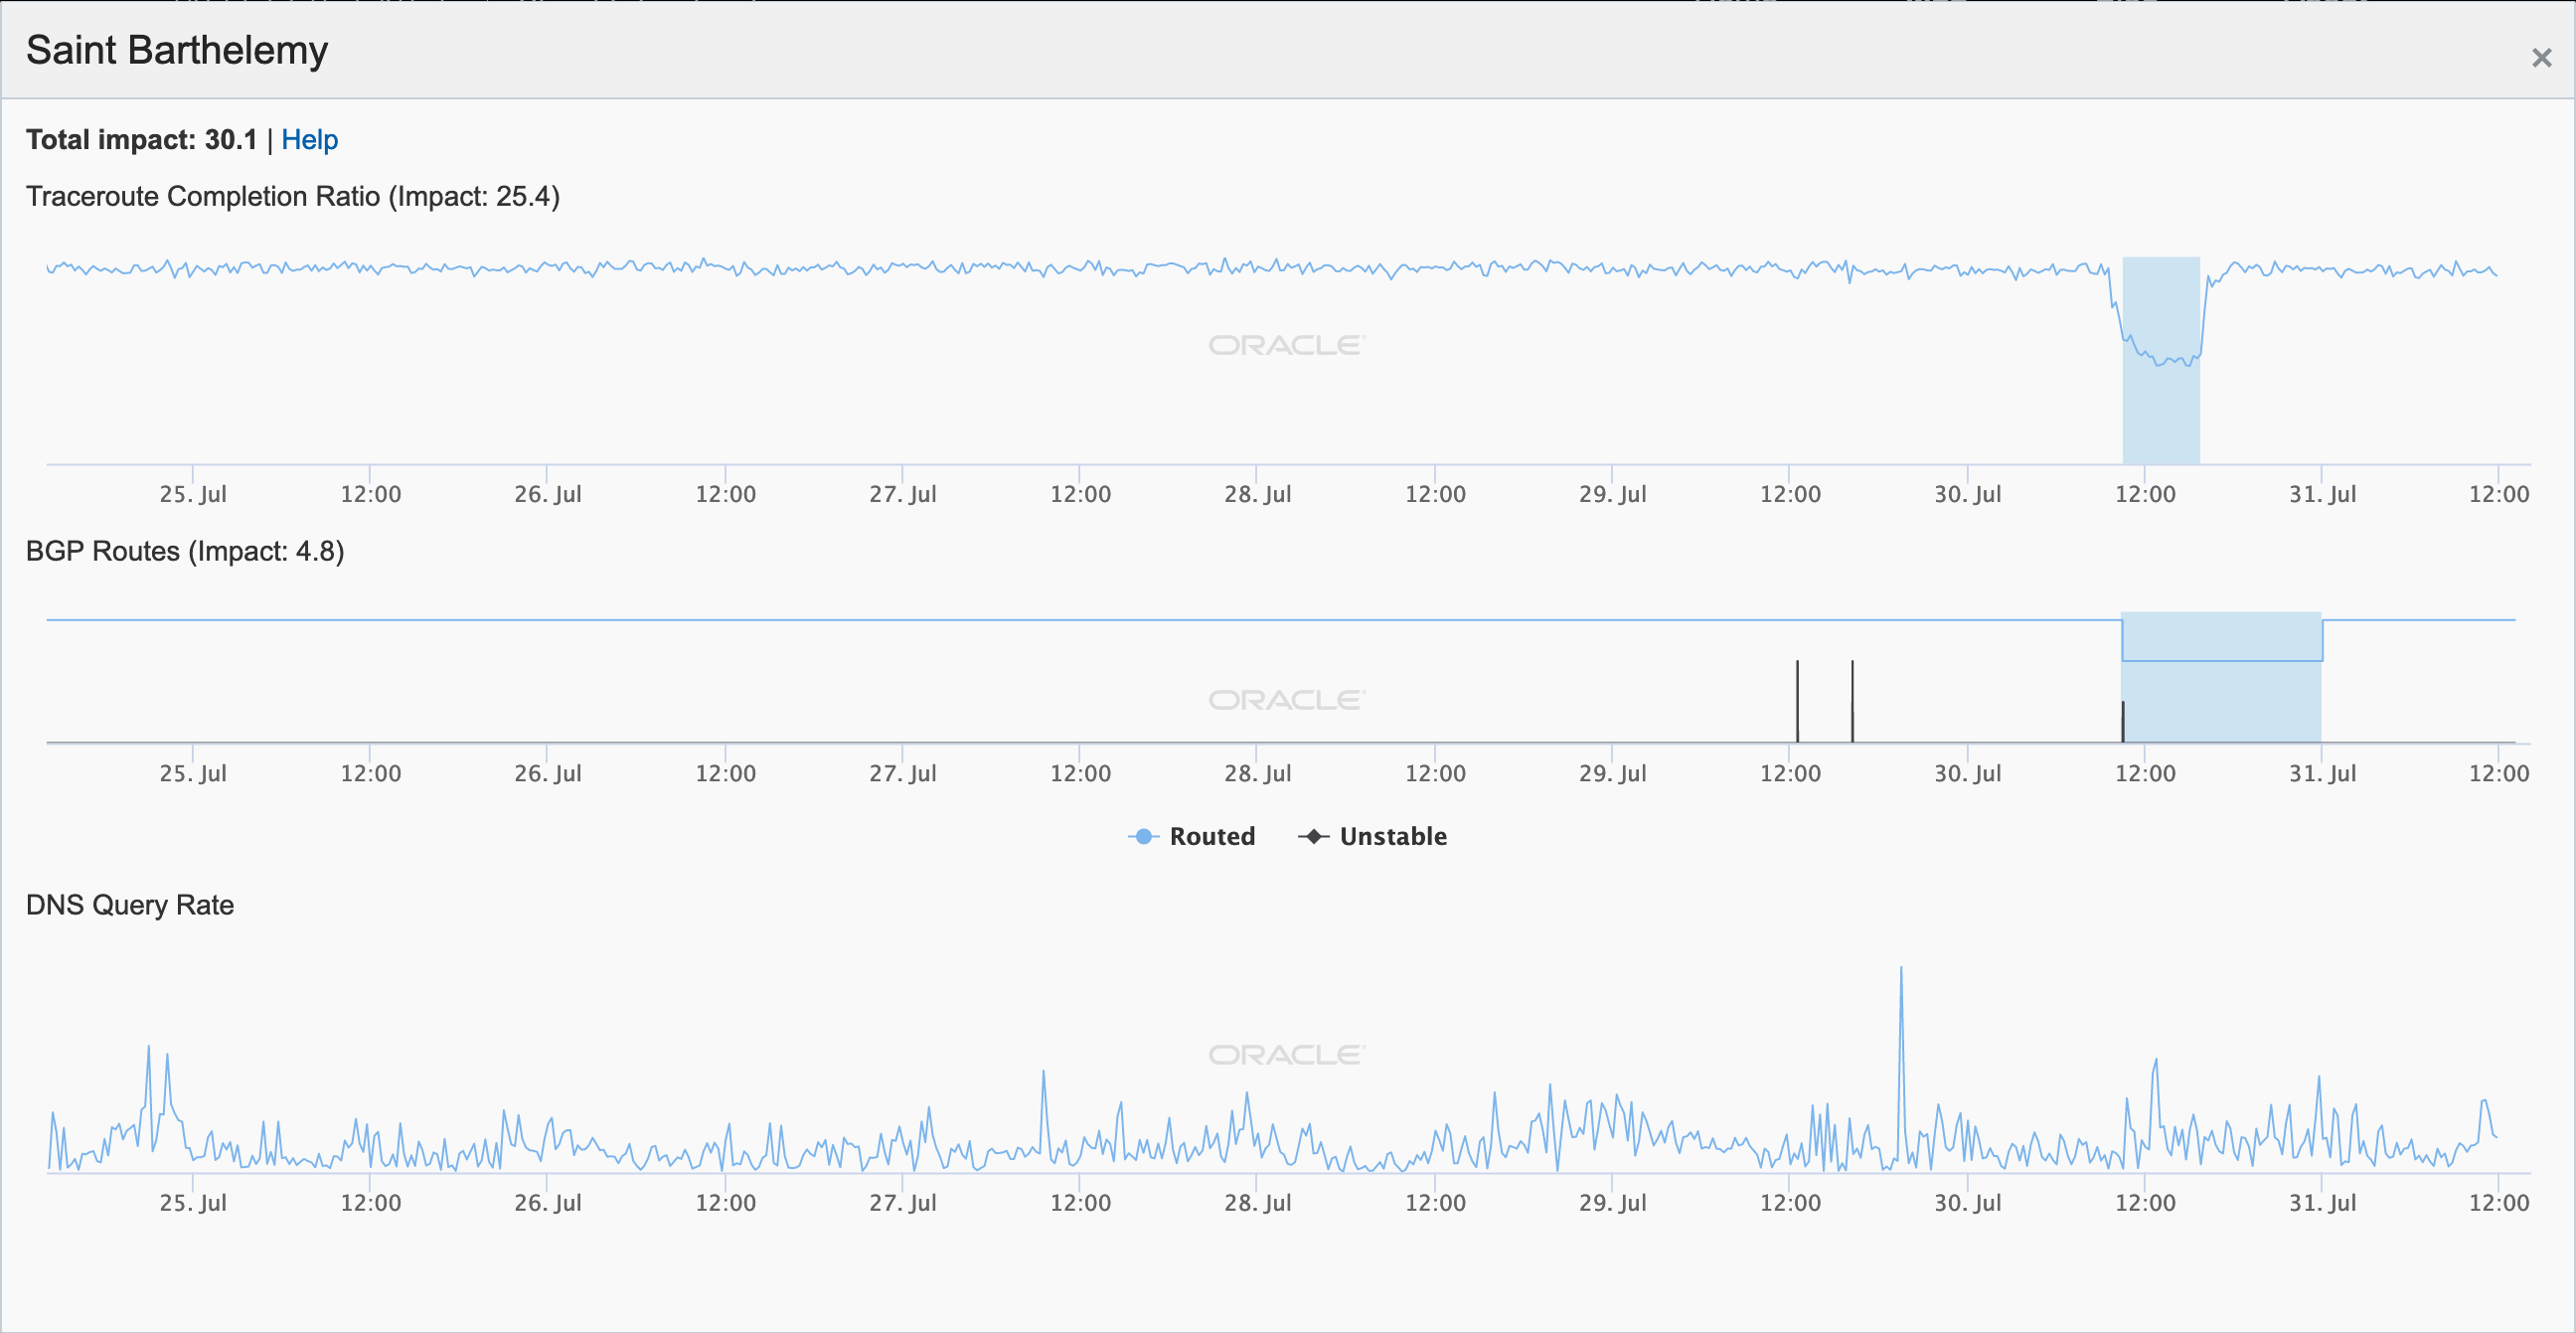
Oracle Internet Intelligence graph for Saint Barthelemy, July 30
Conclusion
Information and data on the severity, duration, and extent of Internet disruptions, both at national and local scales, is becoming increasingly available through organizations like Oracle Internet Intelligence, CAIDA IODA, Fing Internet Alert, the Google Transparency Report, Netblocks, and the Monash University IP Observatory. As such it is becoming easier to learn about and publicize such disruptions when they occur, and to hold the providers accountable for these disruptions.
As seen above and in past posts, many providers are transparent, and use social media to explain (and sometimes even apologize for) what happened. However, many providers not only fail to proactively provide information to their subscribers and the public when such events occur, but they also fail to reply to inbound requests for additional information. (Compounding the problem, some have social media presences that have been inactive for months or years.)
We call on telecommunication and network service providers to be more transparent and more active on social media with respect to providing insights into the causes of observed disruptions, and to actively monitor their social media presence for inbound requests for information. (And of course, to respond to those requests in a timely fashion).
