
In November, many of us in the United States think about the Internet in terms of having to fix the connectivity problems at a relative’s house while visiting them for Thanksgiving, or using it to escape from those same relatives for a few minutes by browsing social media or watching a video. However, across the rest of the world, the connectivity problems seen in November weren’t the kind a quick router reboot would solve. Blackouts caused Internet disruptions in Curaçao and Venezuela, fiber/cable issues caused problems in Haiti, Venezuela, Liberia, Sierra Leone, and the Gambia, and routing issues disrupted connectivity in Indonesia and Ecuador. However, the most significant Internet disruptions in November were week-long government directed shutdowns in Iraq and Iran.
Power Outages
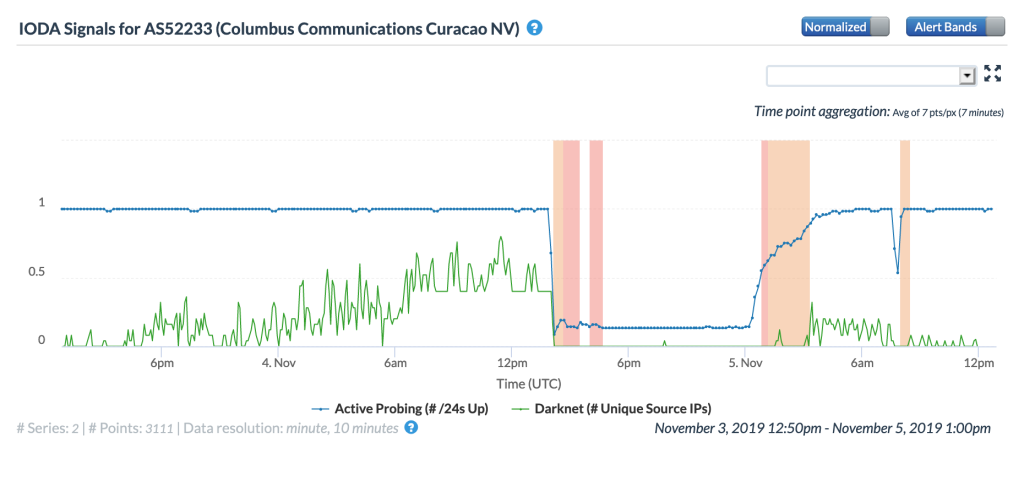
On November 4, the country of Curaçao experienced a power outage that affected the entire island. According to a published report, the power went out around 0915 local time (1315 GMT), and started to come back on around nine hours later. This aligns with the periods of disruption seen in both the Oracle Internet Intelligence and CAIDA IODA graphs below. However, in looking at those graphs, we see that there was nominal impact to the BGP metric in each, and that the Traceroute Completion/Active Probing metrics only saw a slight decline – these two factors indicate that core network infrastructure on the island is likely protected with backup power sources, and also serves as a target for active measurement. Conversely, the Darknet metric at a country- and network-level declined to near zero during the power outage, as shown in the CAIDA IODA graphs below, likely indicating a greater impact on end-user systems.
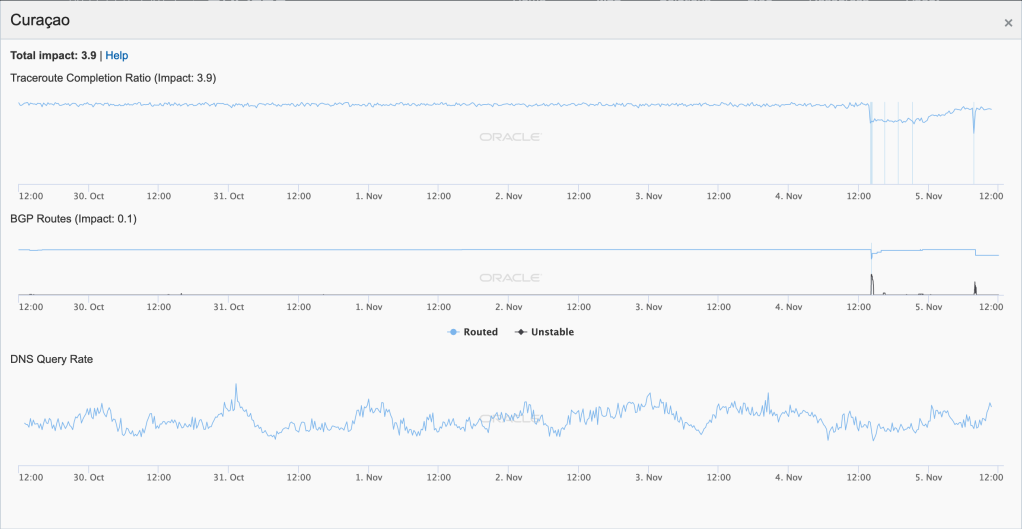
Oracle Internet Intelligence Map Country Statistics graph for Curaçao, November 4 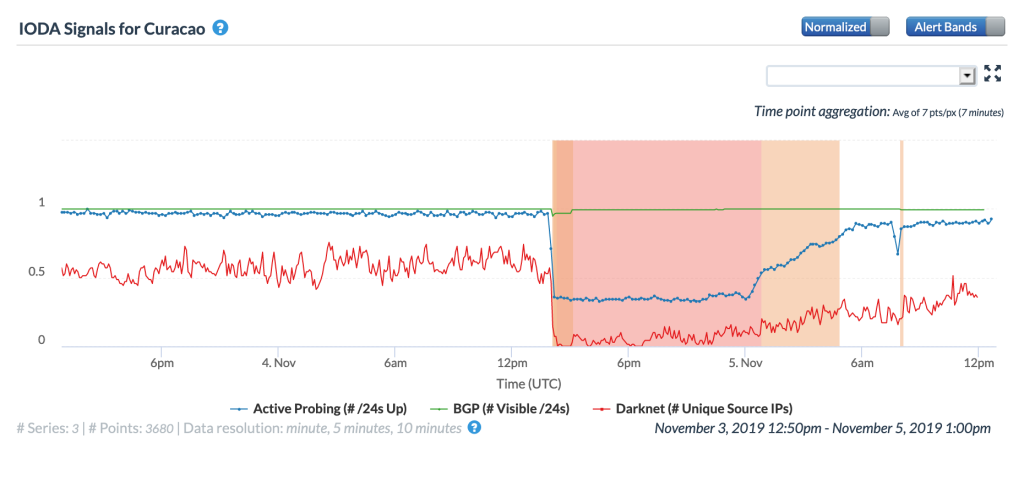
CAIDA IODA graph for Curaçao, November 4
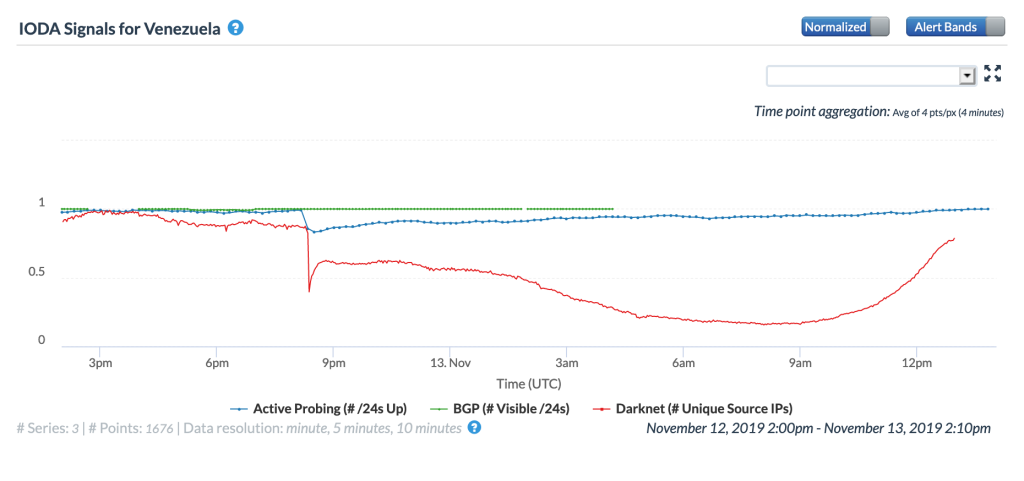
On November 12, Internet monitoring firm NetBlocks noted that a series of blackouts knocked multiple Venezuelan states offline for several hours. Although the NetBlocks post indicates that the power outages and associated connectivity issues started during the morning, the CAIDA IODA graphs below show Internet disruptions occurring later in the day at both a country and regional level. The regional graphs show four Venezuelan states listed by NetBlocks as seeing significant connectivity impact due to the power issues. (Note that the Internet disruptions visible in the graphs may not be related to the power outages highlighted by NetBlocks, given the time differences, but Venezuela is no stranger to Internet disruptions caused by power outages, having experienced multiple such issues over the last few years.)

CAIDA IODA graph for Falcón, Venezuela, November 12 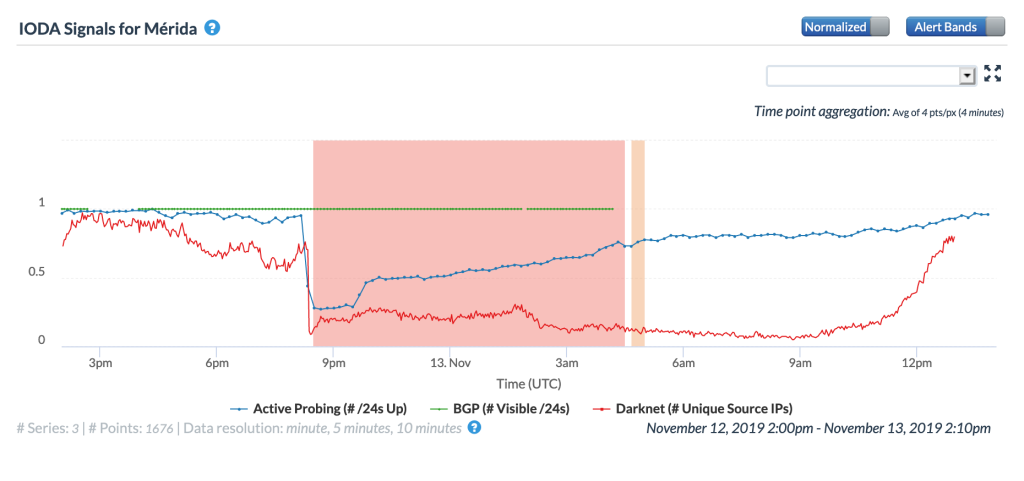
CAIDA IODA graph for Mérida, Venezuela, November 12 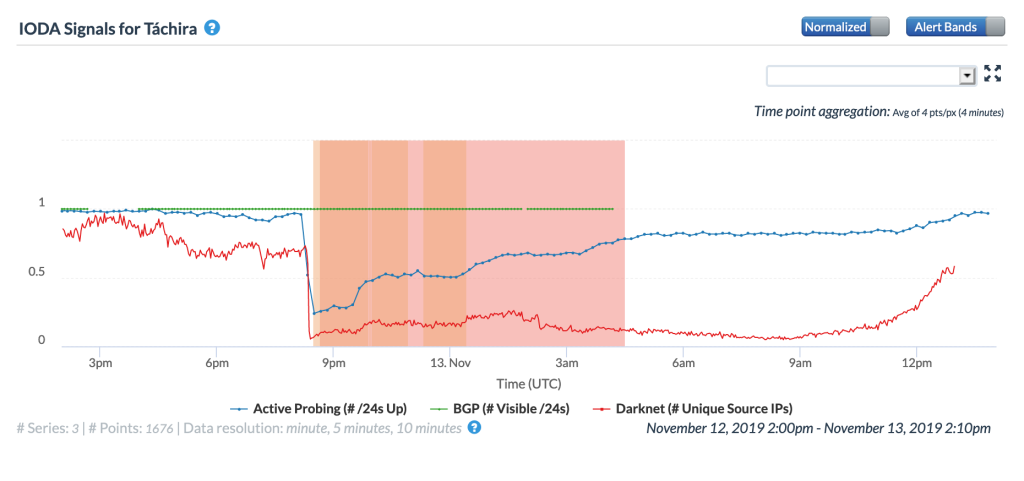
CAIDA IODA graph for Táchira, Venezuela, November 12 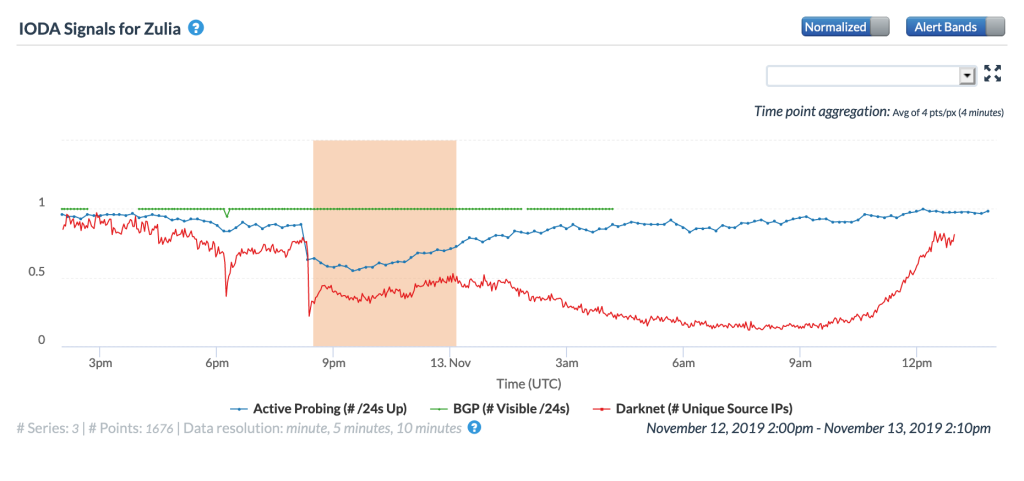
CAIDA IODA graph for Zulia, Venezuela, November 12
Fiber/Cable Issues
Yon kab fib optik ki te koupe nan mitan lannuit la te lakoz rezo a gen difikilte, e sa te afekte sèvis tankou entènèt, apèl entènasyonal, sms. Teknisyen nou yo travay san kanpe pou repare li prese prese. Nou eskize n pou tout enkonvenyan sa te poze pou kliyan nou yo 🙏🏾🙏🏾🙏🏾
— Digicel Haïti (@DigicelHT) November 6, 2019
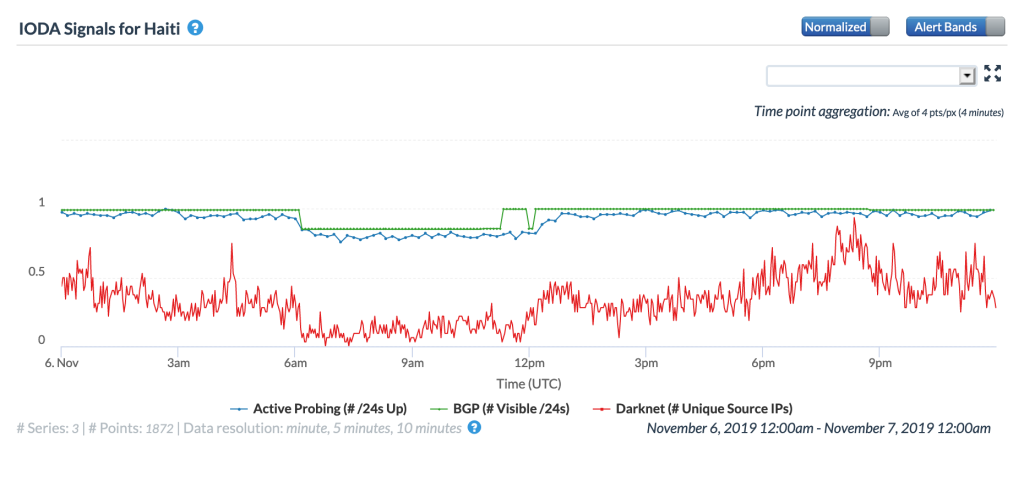
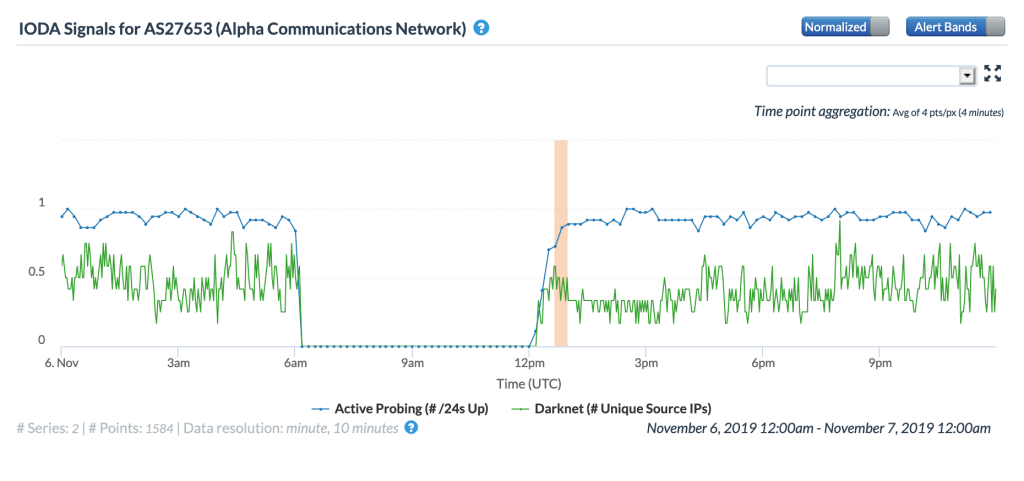
On the morning of November 6, Digicel Haiti Tweeted an explanation of an Internet disruption experienced overnight, noting (via Google Translate) “A fiber optic cable cut in the middle of the night caused network difficulties, affecting services such as Internet, international calls, sms. Our technicians work tirelessly to repair it quickly. We apologize for any inconvenience this posed to our customers.” The CAIDA IODA graphs below show an Internet disruption at both a country- and network-level starting around 0600 GMT (0100 local time), recovering approximately six hours later.
Another fiber cut impacted connectivity in Haiti a week later. On November 13, the Chairman and CEO of Digicel Haiti Tweeted that (via Google Translate) “Today, still a case of sabotage of a major optical fiber of @DigicelHT . This time affecting the 55 antennas covering Carrefour. Access was very complicated for engineers (a lot of shooting in the area). They are on site and repairs are in progress.”
Aujourd’hui, encore un cas de sabotage d’une fibre optique majeure de @DigicelHT. Cette fois ci affectant les 55 antennes couvrant Carrefour.
— Maarten Boute (@mboute) November 13, 2019
L’accès a été très compliqué pour les ingénieurs (beaucoup de tirs dans la zone).
Ils sont sur place et les réparations sont en cours.
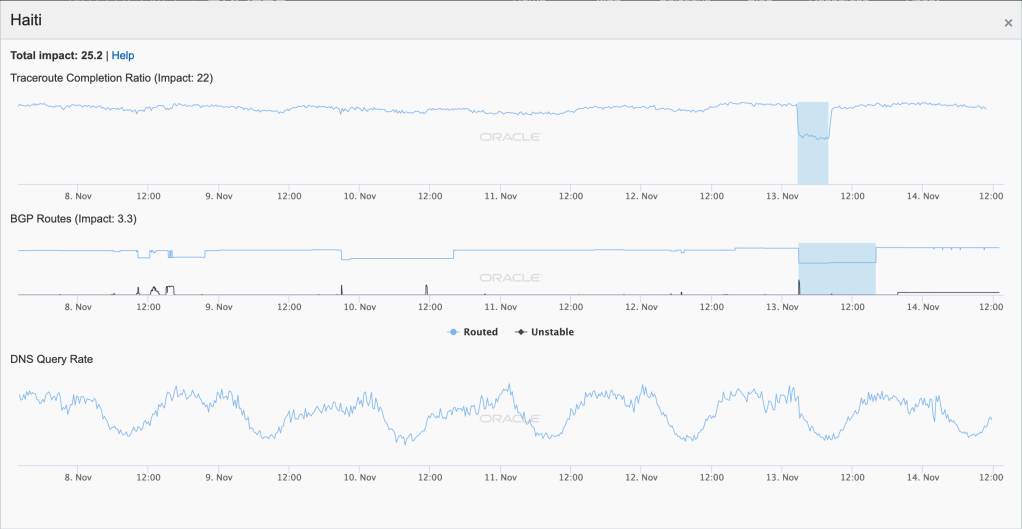
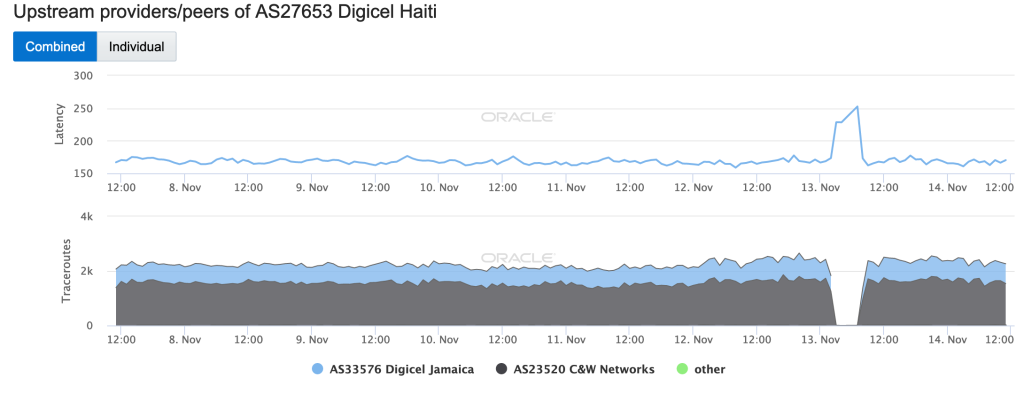
The Oracle Internet Intelligence and CAIDA IODA graphs below show that the disruption began around 0300 GMT, impacting the Traceroute Completion/Active Probing and BGP metrics at a country level. It is interesting to note that the BGP metric was impacted – the fiber sabotage apparently impacted connectivity to key Digicel Haiti routing infrastructure. This is more evident in the network-level graphs below, with the CAIDA graph showing a complete loss of routed networks for AS27653 at the same time that both the Oracle and CAIDA graphs show traceroutes/active probing to Digicel Haiti effectively dropping to zero.
Oracle Internet Intelligence Map Country Statistics graph for Haiti, November 13 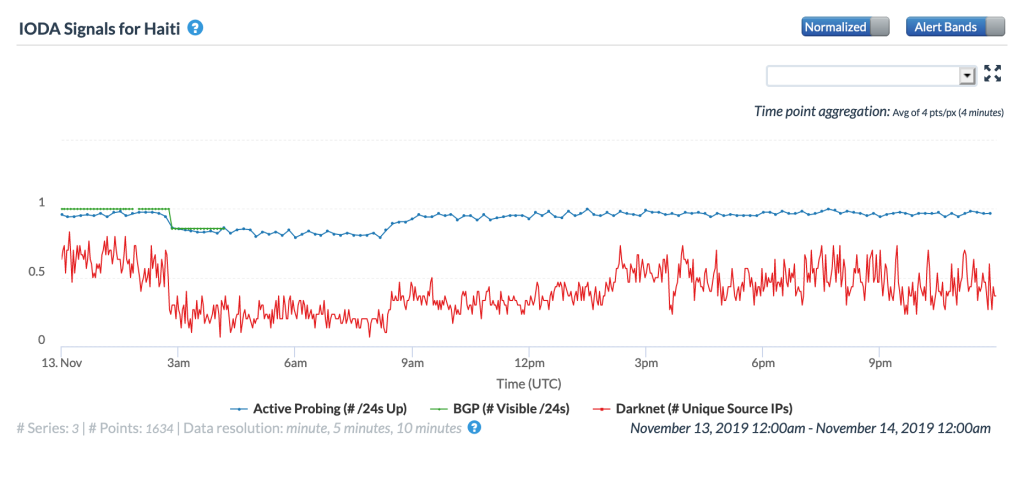
CAIDA IODA graph for Haiti, November 13
Oracle Internet Intelligence Map Traffic Shifts graph for AS27653 (Digicel Haiti), November 13 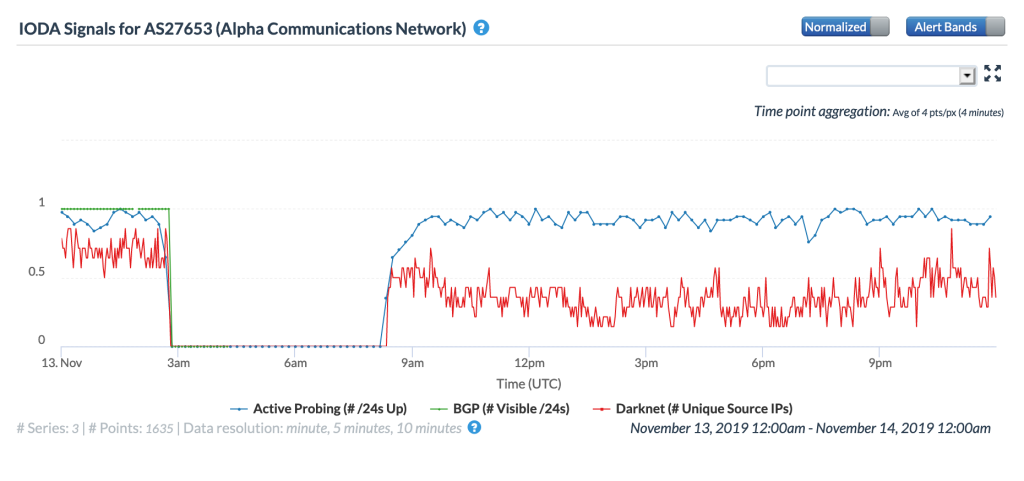
CAIDA IODA graph for AS27653 (Digicel Haiti), November 13
On November 17, concurrent Internet disruptions were observed in Sierra Leone, Liberia, and the Gambia, occurring around 1045 GMT, as illustrated in the figures below. Because the Africa Coast to Europe (ACE) submarine cable lands in each of these countries, it was suspected that problems with the cable caused these observed disruptions.

Oracle Internet Intelligence Map Country Statistics graph for Sierra Leone, November 17 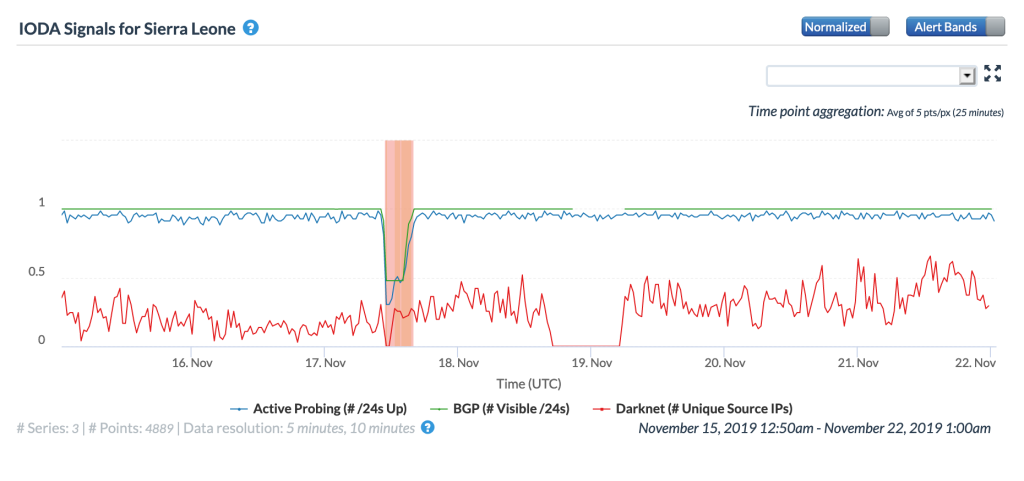
CAIDA IODA graph for Sierra Leone, November 17

Oracle Internet Intelligence Map Country Statistics graph for Liberia, November 17 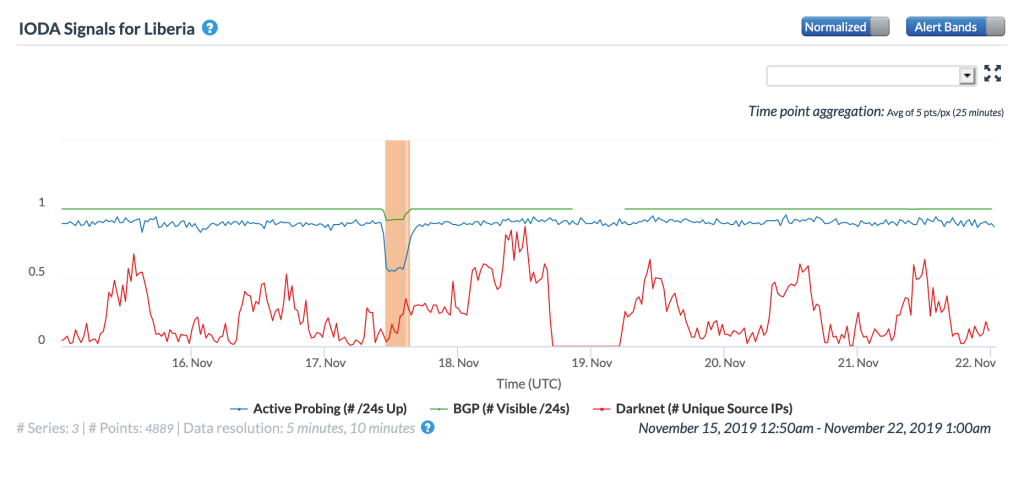
CAIDA IODA graph for Liberia, November 17
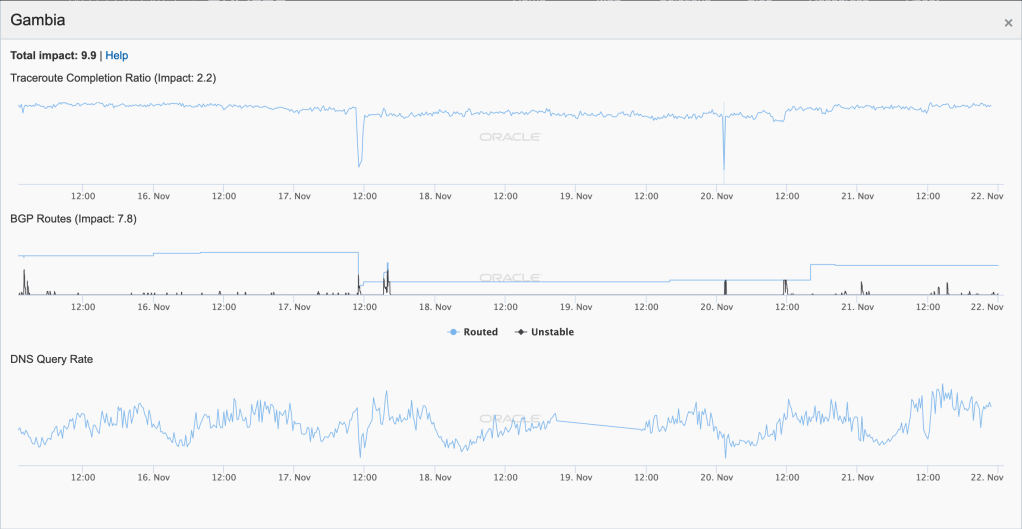
Oracle Internet Intelligence Map Country Statistics graph for The Gambia, November 17 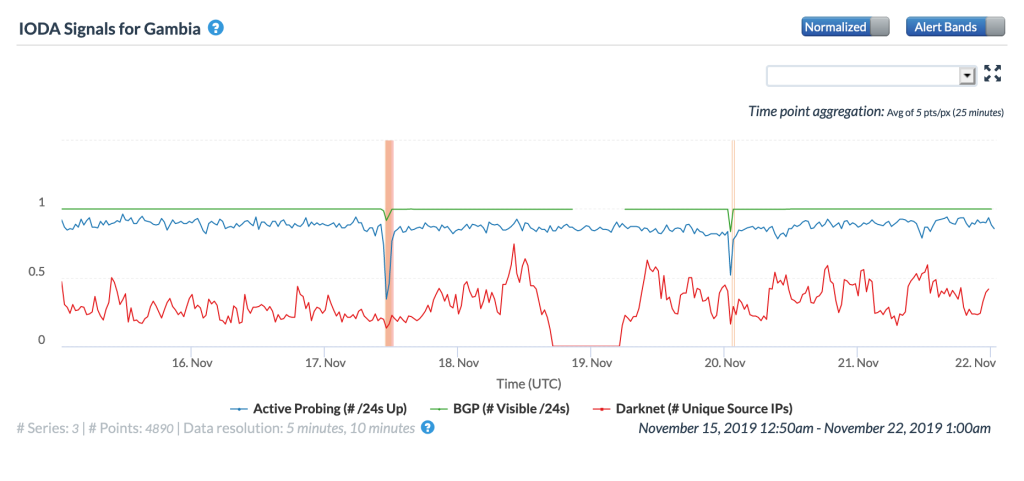
CAIDA IODA graph for The Gambia, November 17
In response to an inquiry, the Twitter account associated with the ACE submarine cable system (@acesubmarinec) confirmed that the observed disruptions were, in fact, due to problems with the cable.
@InternetDsrptns
— Africa Coast to Europe (@acesubmarinec) December 6, 2019
Yes there was a disruption of the traffic on ACE between Banjul and Dakar to fix shunt falt. Everything went well and the traffic is now on. Sorry for the inconvenient and thanks for reaching out.
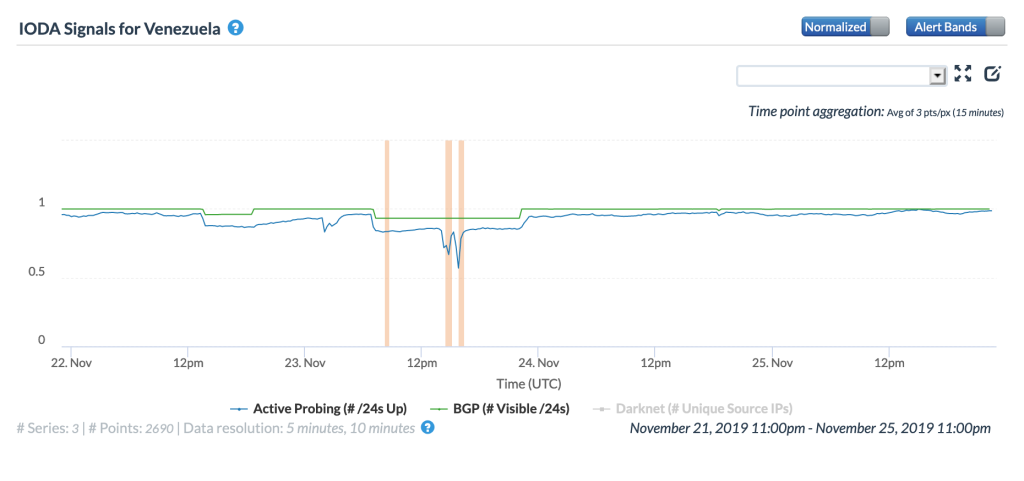
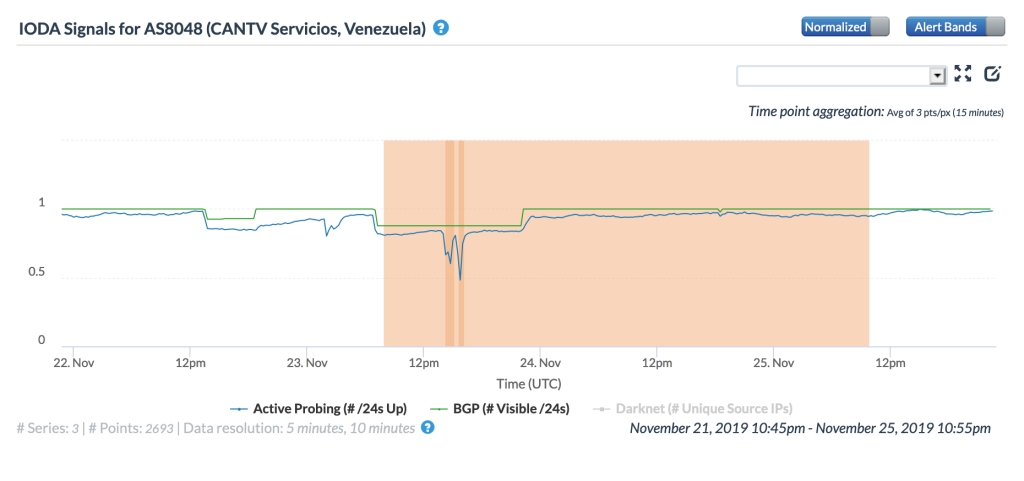
Making its third appearance in this month’s report, Venezuela experienced an Internet disruption on November 22 and 23 due to a fiber optic cable cut at state-run Internet service provider CANTV. In a Twitter thread, CANTV stated that (via Google Translate) “Cantv Informs that motivated to technical incidence presented at the La Pedrera plant in #Táchira , and a fiber optic cut originated in the Cabimas-El Venado axis, in #Zulia , telecommunications are affected in #Barinas #Mérida #Táchira #Trujillo #Falcón and #Zulia” The disruption is evident at a country level in the CAIDA IODA graph below, with nominal impact visible starting mid-day (GMT) on November 22 and lasting approximately six hours. The level of impact is similar at a network level, as the CAIDA IODA graph for CANTV below illustrates. The disruption visible on November 23 is likely related to a second CANTV issue that was reported by NetBlocks.
The CANTV Tweet listed six specific Venezuelan states where telecommunications were affected on November 22. The CAIDA IODA graphs below for these states highlight the impacts to Internet connectivity in each. It appears that the disruption was the least significant in Barinas, and most severe in Mérida, Táchira, and Zulia – the latter two were mentioned in the Tweet as locations where problems occurred.
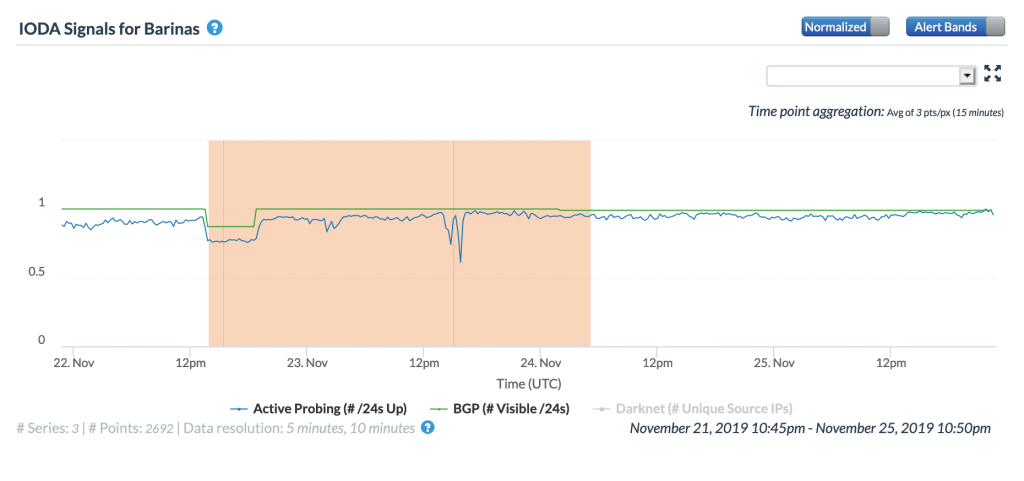
CAIDA IODA graph for Barinas, Venezuela, November 22-23 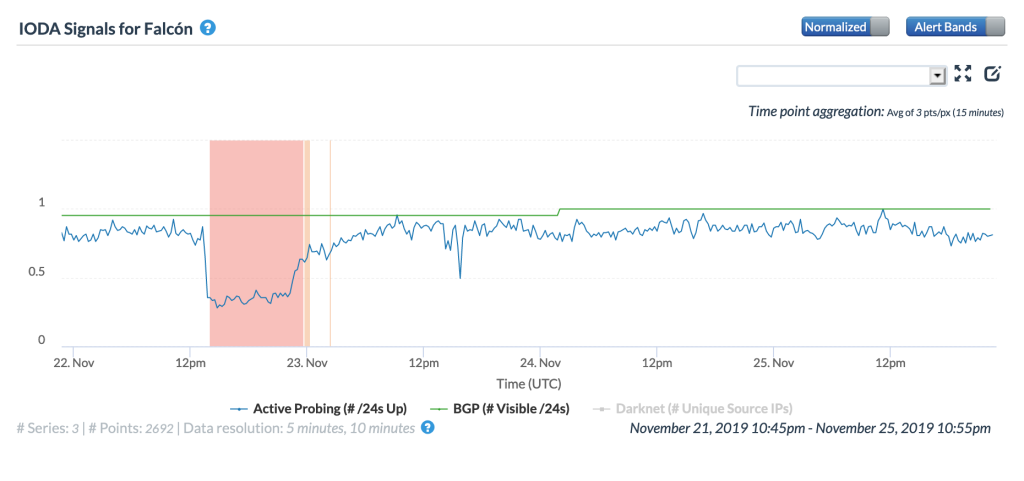
CAIDA IODA graph for Falcón, Venezuela, November 22-23 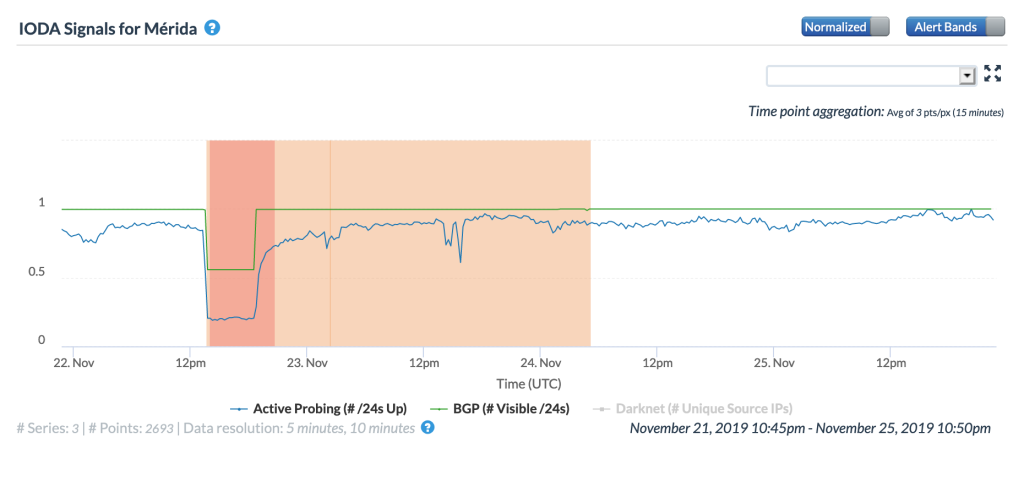
CAIDA IODA graph for Mérida, Venezuela, November 22-23 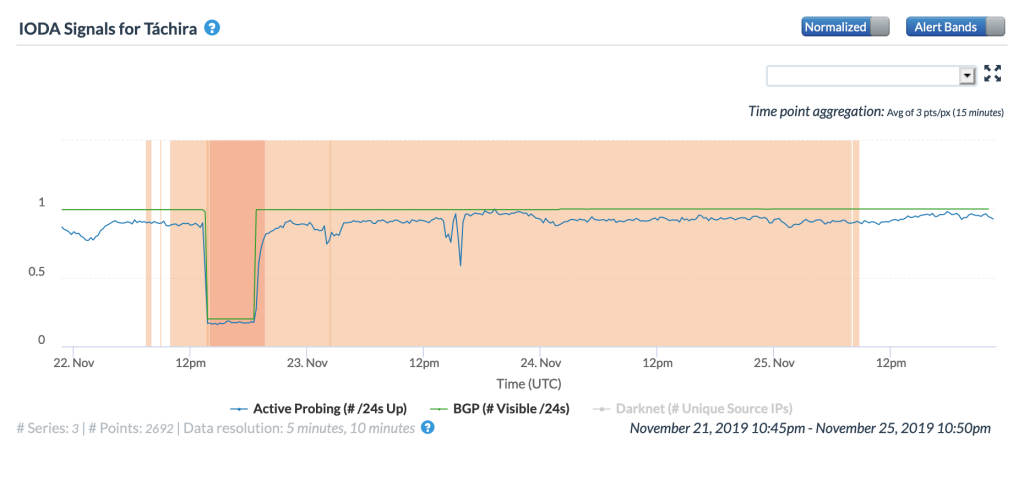
CAIDA IODA graph for Táchira, Venezuela, November 22-23 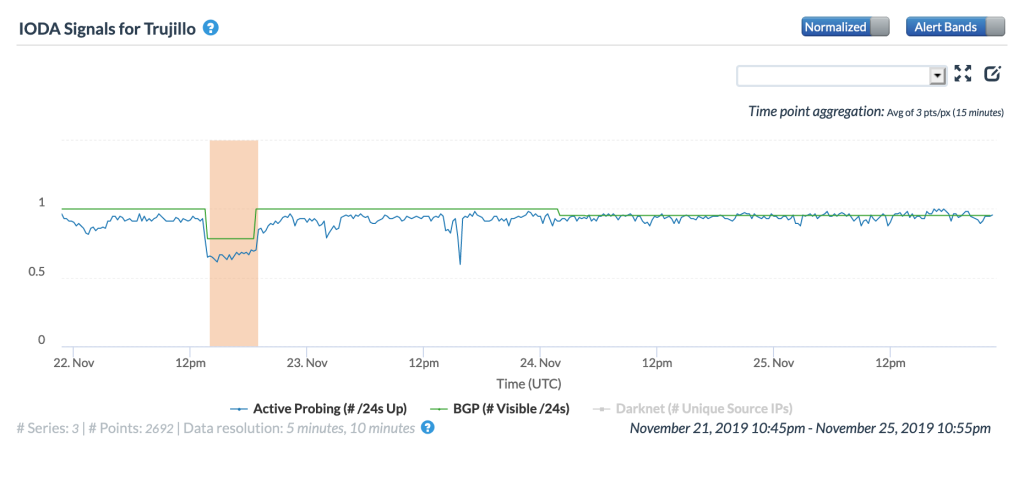
CAIDA IODA graph for Trujillo, Venezuela, November 22-23 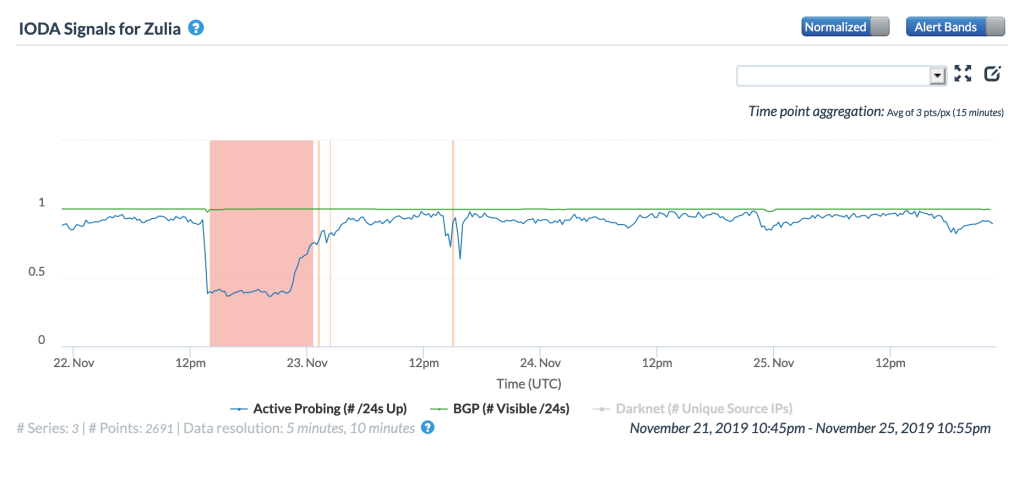
CAIDA IODA graph for Zulia, Venezuela, November 22-23
Routing Issues
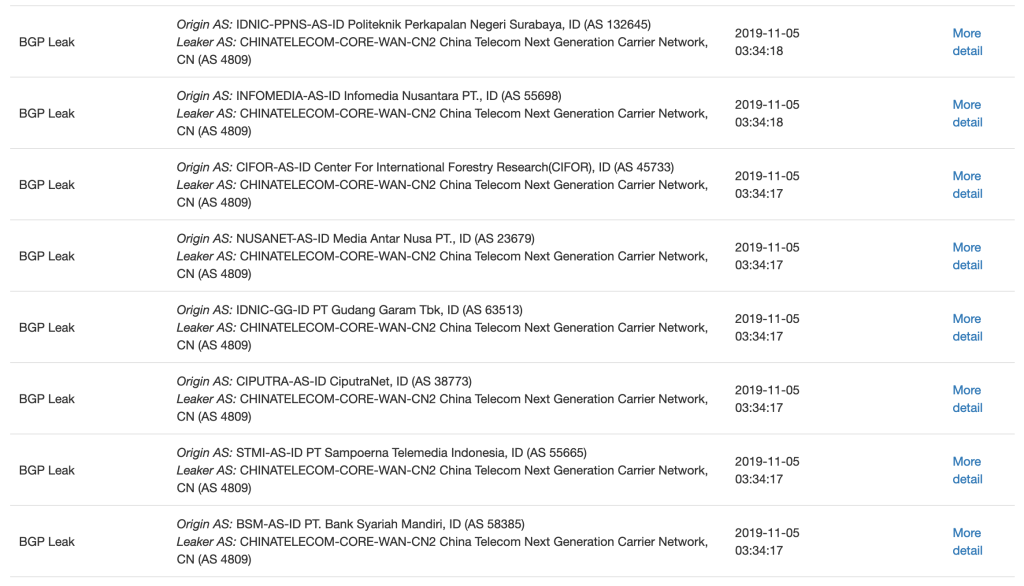
On November 5, Oracle Internet Intelligence (@InternetIntel) Tweeted about a route leak that briefly interrupted Internet connectivity in Indonesia. The screenshot below from BGPStream shows that a route leak from China Telecom just after 0330 GMT impacted a number of Indonesian networks.
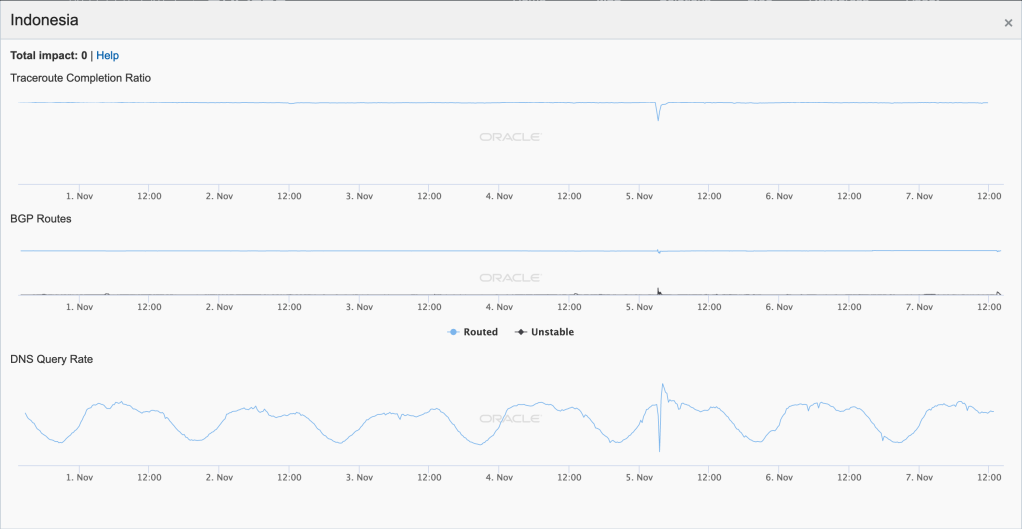
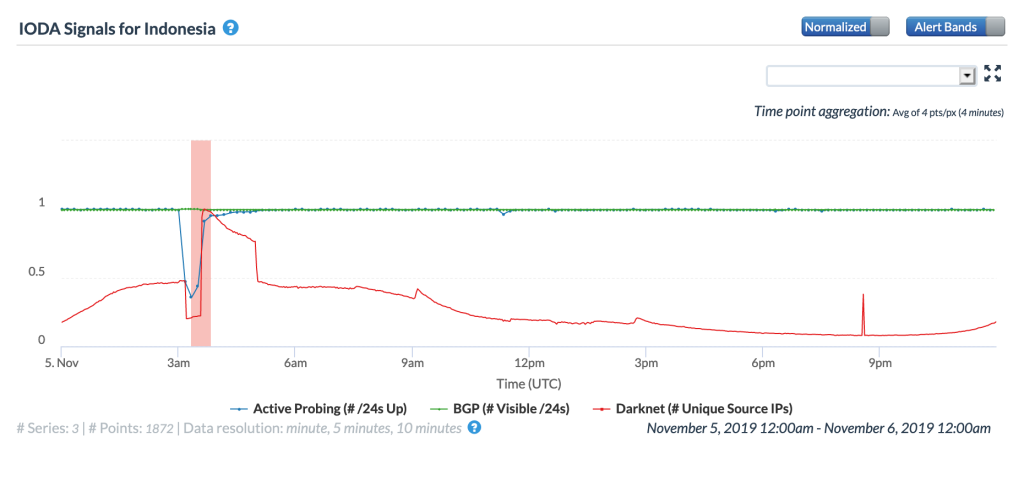
The Oracle Internet Intelligence graph below shows that their measurements saw a brief blip in the BGP metric, with more noticeable (but still brief and nominal) impacts to the Traceroute Completion and DNS Query Rate metrics. In line with the latter impacts shown in the Oracle graph, the CAIDA IODA graph below shows significant impacts to their Active Probing and Darknet metrics, with no clear impact to the BGP metric.
Just a few days later, Oracle Internet Intelligence Tweeted about another route leak, this one affecting networks in Ecuador. They stated that the leak started just before 0900 GMT on November 9, and lasted almost five hours. According to the BGPStream screenshot below, global service provider CenturyLink and Ecuadorian service provider Telconet were involved.

The figures below show the impact of this route leak at a country level, based on Oracle Internet Intelligence and CAIDA IODA measurements. While Oracle saw a minimal impact on its Traceroute Completion metric, the impact on CAIDA’s equivalent Active Probing metric appears to be more significant. However, there was no visible impact to the BGP metric on either graph. The network level graphs below show the impact to Telconet. Both measurement platforms show a significant decrease in their active measurement metrics. Interestingly, there was no decrease in the CAIDA Darknet metric, which would indicate that although packets were having a harder time getting into the network, they were still able to get out.
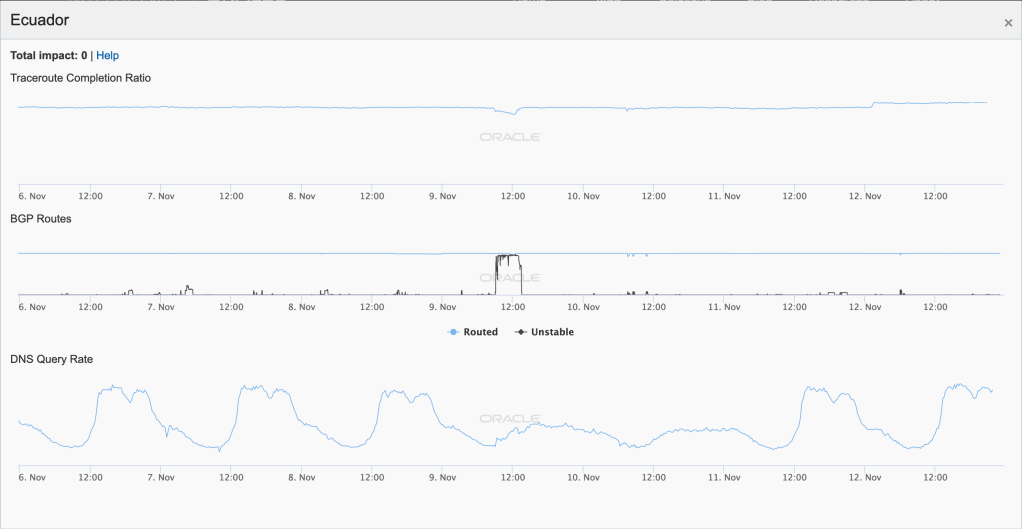
Oracle Internet Intelligence Map Country Statistics graph for Ecuador, November 9 
CAIDA IODA graph for Ecuador, November 9
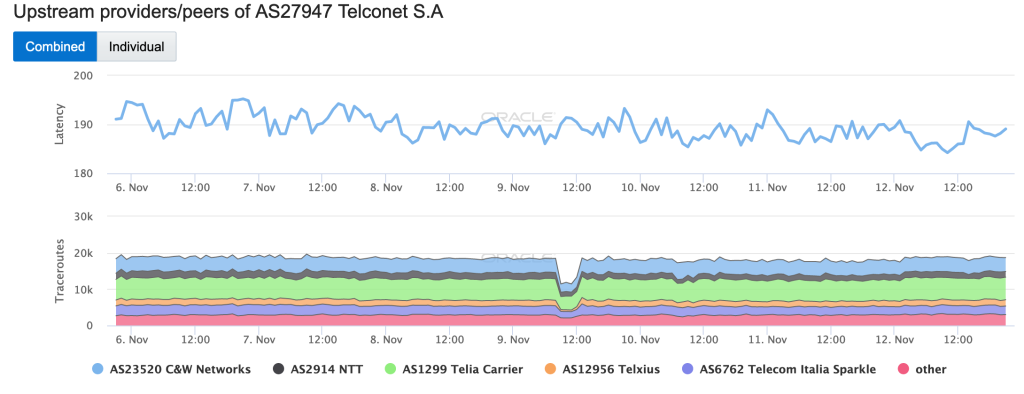
Oracle Internet Intelligence Map Traffic Shifts graph for AS27947 (Telconet), November 9 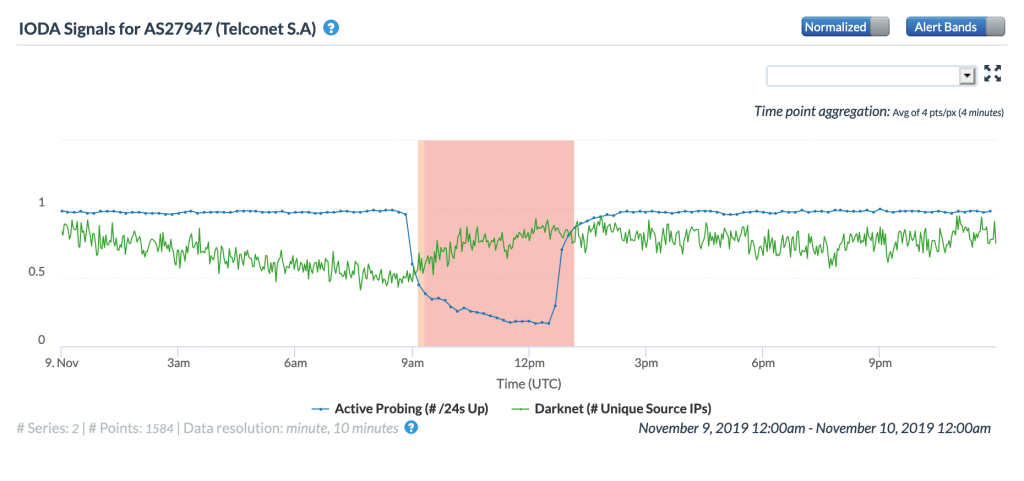
CAIDA IODA graph for AS27497 (Telconet), November 9
Government Directed
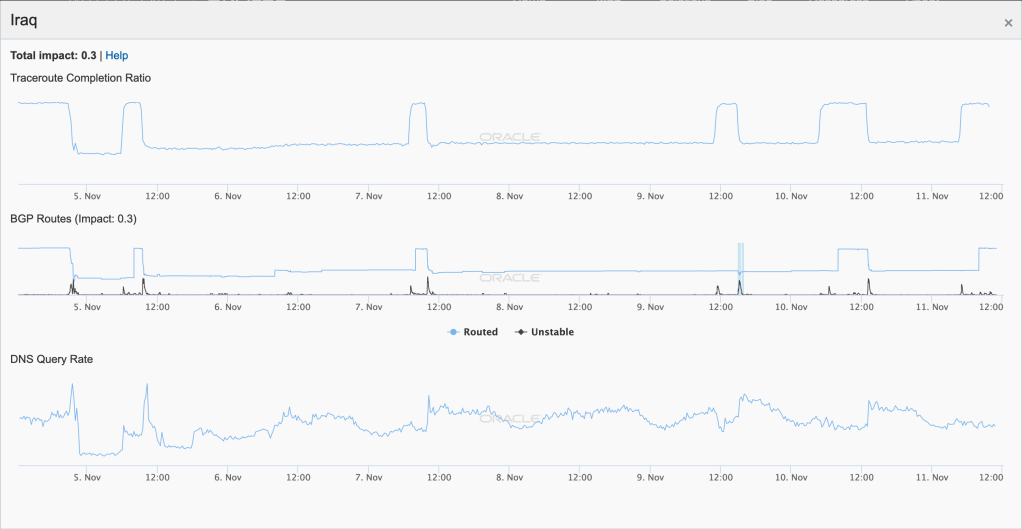
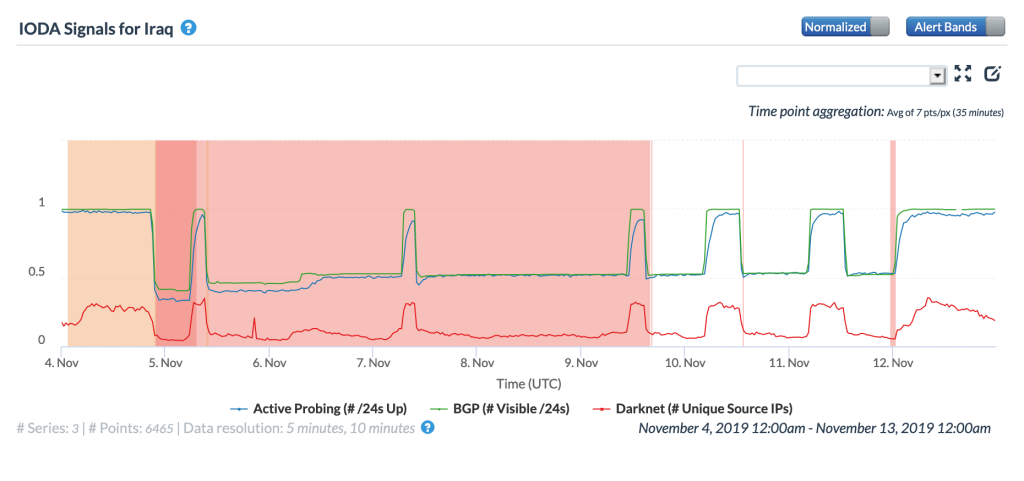
NetBlocks was the first to sound the alarm on Twitter of a wide-scale Internet shutdown in Iraq starting at 0000 GMT on November 5. The shutdown occurred in the wake of reported anti-government protests that resulted in multiple deaths.
⚠️ Alert: Internet shut down across most of #Iraq as of 00:00 5 November with loss of life reported as protests intensify; national connectivity down to 19% of ordinary levels; incident ongoing #iraq_protests #KeepItOn 📉https://t.co/SeCyP2mj1T pic.twitter.com/WxYX54WXH9
— NetBlocks.org (@netblocks) November 4, 2019
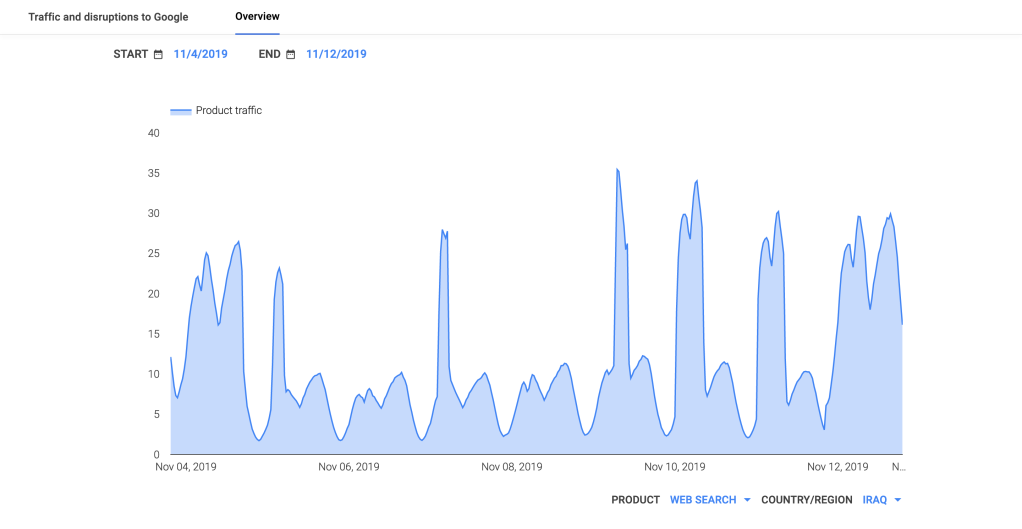
As the figures below illustrate, the disruption lasted a week, from November 5 through November 12. Connectivity returned briefly on the 5th and 7th, but the restorations were short-lived. Longer, more consistent restoration of connectivity is evident during the last three days of the disruption, in a pattern NetBlocks called “curfew-like information controls”. Given the timing, it appears that Internet connectivity was restored roughly in line with the local work day, and then shut down again until the next morning. (Iraq and other countries have implemented a similar “curfew” model in the past.) And while Internet connectivity returned to “normal” on the 12th, access to social media platforms reportedly remained blocked, as it had been since early October.
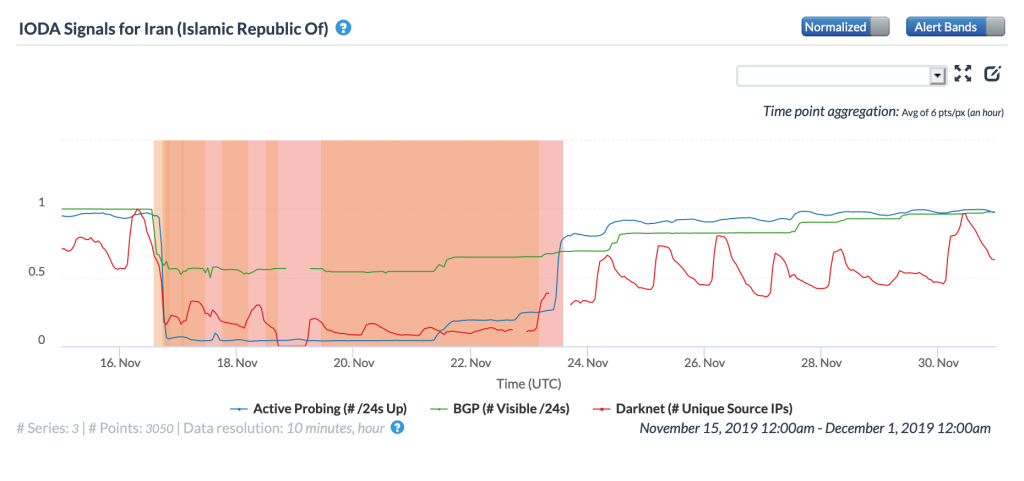
On November 15, protests erupted across Iran in response to a steep increase (on the order of 50%) in officially set gasoline prices. The protests broadened to include additional grievances, including social repression and corruption, and a number of people were killed after police clashed with the protestors. In response to the protests, the Iranian government disrupted Internet connectivity and mobile data services in an effort to prevent citizens from organizing additional protests and sharing information.
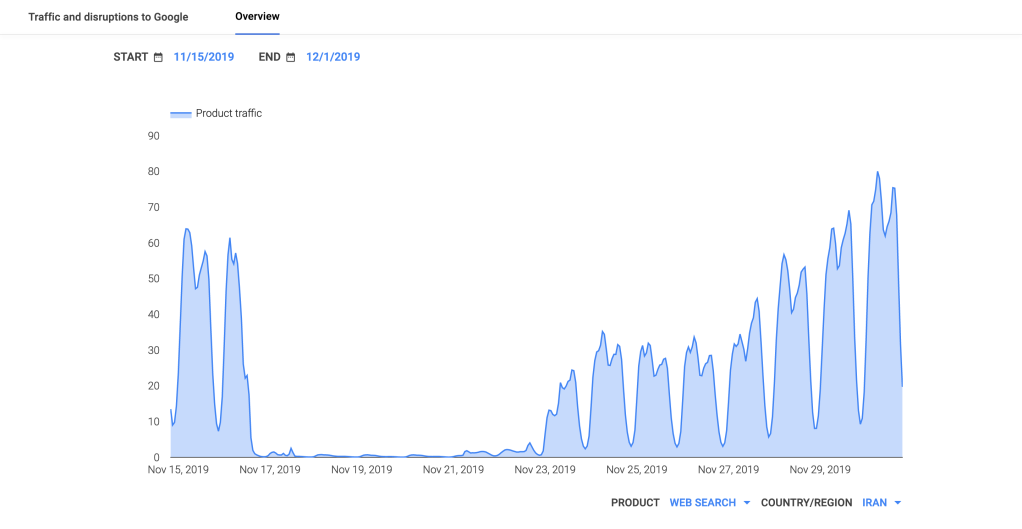
The figures below show that the Internet disruption began on November 16, and lasted until November 23. However, as the Google Transparency Report traffic graph shows, while connectivity was initially restored on the 23rd, it took nearly another week for traffic levels to Google services to reach pre-disruption levels.
The difficulty of shutting down Internet connectivity in a country depends in part of the centralization of such connectivity. In countries with a centralized infrastructure, where international Internet traffic is routed via a state-run telecommunications provider, a shutdown can be implemented through the actions of that single provider, effectively creating a so-called “kill switch”. In countries with international Internet connectivity routed via multiple providers, a shutdown must be coordinated across those providers.
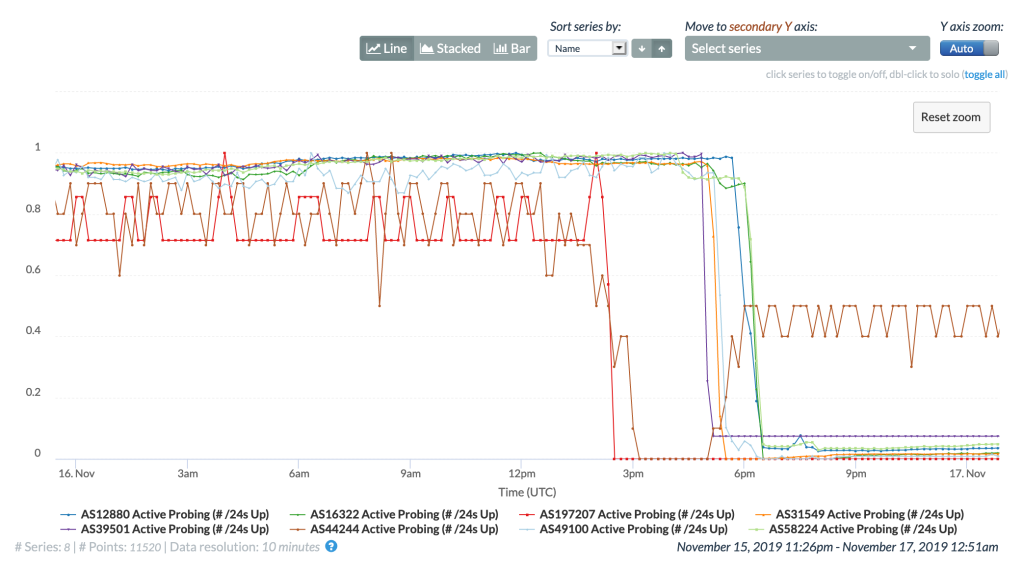
Although the Iranian government has focused on building out a centralized national “intranet” over the past decade, the CAIDA IODA figure below shows that this disruption was of the latter type described above, with connectivity dropping across multiple networks over the course of several hours, instead of all at once, as if a single “kill switch” had been thrown. The graph shows that, among the network providers shown in the graph, connectivity was first lost at 1430 GMT on AS197207 (Mobile Communication Company of Iran), while connectivity on AS58224 (Iran Telecommunication Company) and AS16322 (Pars Online) didn’t drop until 1730 GMT. Interestingly, while connectivity to AS44244 (Iran Cell Service and Communication Company) dropped around 1500 GMT, endpoints within the network were again reachable by active probing measurements starting a couple of hours later.
(The autonomous systems in the figures below are those that were included in a now-deleted Tweet from Cloudflare’s CTO (@jgrahamc) that showed traffic volumes to Cloudflare’s platform from these networks in response to the initial Internet disruption and subsequent restoration of connectivity.)
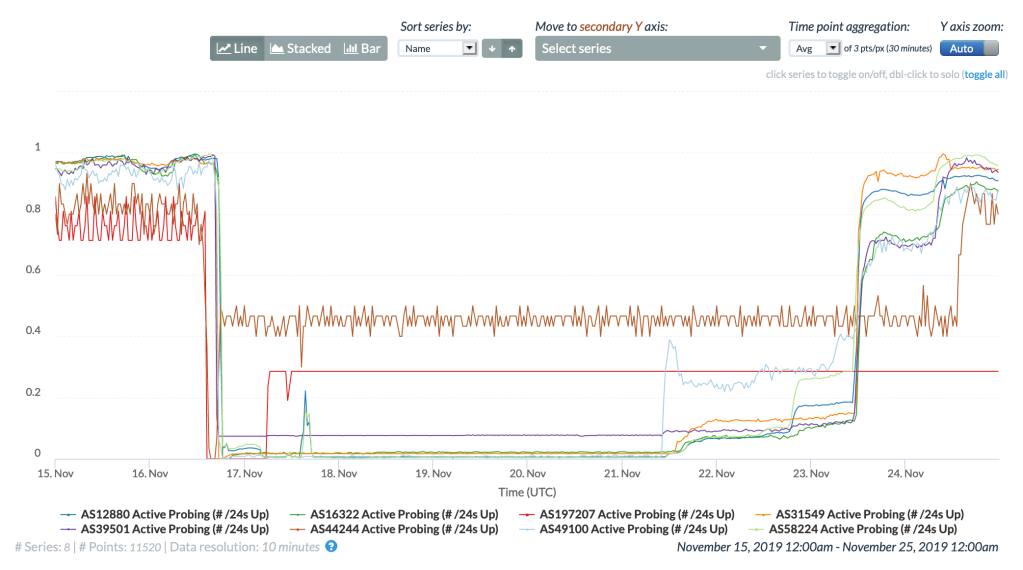
The figure below shows the results of CAIDA IODA Active Probing measurements to the set of autonomous systems during the disruption event period. As noted above, AS44244 began responding to active probing measurements again several hours after it initially lost connectivity. As seen in the graph below, a partial restoration of connectivity for AS197207 apparently occurred as well, as endpoints within that network began responding to measurement probes around 0600 GMT on November 17. It also appears that connectivity for AS39501 (NGSAS) was never completely disrupted, as it maintained some level of response to measurement probes across the duration of the disruption.
Restoration of connectivity was gradual, and nominally concurrent, as the Active Probing metric began a slow increase on November 21, leading to a more significant jump on the 23rd, reaching near-“normal” levels on the 24th.
In the figure above, the active probing metric approaches, but never fully reaches, zero across the surveyed networks, suggesting that the disruption was not a full and complete shutdown, at least for traffic to those networks. The figure below shows the CAIDA IODA Darknet metric across the surveyed autonomous systems during the disruption period. (The Darknet metric represents unique source IP addresses in those networks generating unsolicited traffic reaching the UCSD Network Telescope, which is monitoring an unutilized /8 address block.) While the beginning and end of the disruption are evident in the graph, it also shows that unsolicited traffic was detected originating from IP addresses in several surveyed networks, including AS16322 and AS49100 (Pishgaman Toseeh Ertebatat Company), among others. This suggests that some traffic was able to get out of these networks as well. (The gaps in the graph on November 19, 22, and 23 were due to problems with the underlying data processing infrastructure, and are not related to the Internet disruption discussed here.)

The observation that some small amount of traffic was apparently able to get into and out of some of the disrupted networks is in no way intended to minimize the severity of what occurred. Rather, it highlights the complexity of executing a complete Internet shutdown, and also suggests that there may have been some reason that some level of connectivity was maintained to selected networks — it is possible that customers include government agencies, financial institutions, or other influential organizations.
Additional coverage of the initial disruption and subsequent restoration of connectivity, including views from other metrics, can be found in posts from NetBlocks (1,2), Oracle Internet Intelligence (1,2), the Monash IP Observatory, OONI, and Filterwatch, as well as a Twitter thread from Internet security and digital rights reseaercher Amir Rashidi.
Conclusion
The two government-directed Internet disruptions reviewed in this month’s post are noteworthy and extremely concerning due to their severity and their duration. These actions disconnected citizens in both Iran and Iraq from the global Internet for week-long periods, including those uninvolved in the protests, and also prevented citizens from communicating with friends and loved ones within the country and across the rest of the world.
The United Nations has explicitly identified such government directed Internet shutdowns and censorship as a human rights violation, but that does not seem to deter these countries from taking such actions. However, these actions can also have unintended effects, as they also serve to limit a government’s ability to conduct online surveillance of citizens, as well as potentially fostering even more powerful protest movements among impacted citizens, even if they aren’t able to use Internet-based tools to organize. Governments also need to recognize that these disruptions have international technical impacts and long-term financial impacts, hurting their country now and into the future.

[…] Liberia, and Benin from 1725 to 1825 GMT. In November, a similar event occurred, and we noted in that month’s post, “Because the Africa Coast to Europe (ACE) submarine cable lands in each of these countries, […]
[…] nationwide connectivity disruptions were recorded in November 2019 and January 2020,” according to a 2020 Freedom House […]
[…] nationwide connectivity disruptions were recorded in November 2019 and January 2020,” according to a 2020 Freedom House […]
[…] noviembre de 2019 y enero de 2020 se registraron breves interrupciones de conectividad a nivel nacional”, según […]
[…] nationwide connectivity disruptions were recorded in November 2019 and January 2020,” according to a 2020 Freedom House […]