
January 2020 brought the start of both a new year and a new decade, not to mention the continued deployment of satellite constellations that will be used to provide broadband Internet connectivity around the world. While space-based Internet connectivity holds promise for the future, Internet connectivity delivered through terrestrial and submarine infrastructure saw its fair share of problems throughout the month. In January, Internet disruptions caused by earthquakes, power outages, network maintenance, government direction, and cable cuts were observed.
Note: Previous posts have frequently differentiated between the “Traceroute Completion Ratio” metric used by Oracle Internet Intelligence and the “Active Probing” metric used by CAIDA IODA. As traceroute-based measurement is a form of active probing, posts will generally refer to both metrics as “active probing” going forward. However, references to specific metrics in a specific graph will continue to use the appropriate label.
Earthquake
On January 7, a 6.4 magnitude earthquake struck Puerto Rico, disrupting both fixed and wireless Internet connectivity in the territory. The impact of the earthquake at a country level can be seen in the Oracle Internet Intelligence, CAIDA IODA, and Google Transparency Report graphs below. While the BGP metric remains effectively unchanged, the active probing metrics show a nominal drop at the time the earthquake occurs, with a gradual recovery over the next several days. The traffic-related metrics exhibit a more significant drop, with a similar recovery pattern. These observations are consistent with what is frequently seen in these scenarios, as earthquakes often cause widespread power outages. Because key infrastructure, including the routers making BGP announcements, is likely to be in data centers with backup power sources, the BGP metrics will see little change while power failures take active probing targets and end-user systems offline.

Oracle Internet Intelligence Map Country Statistics graph for Puerto Rico, January 7-10 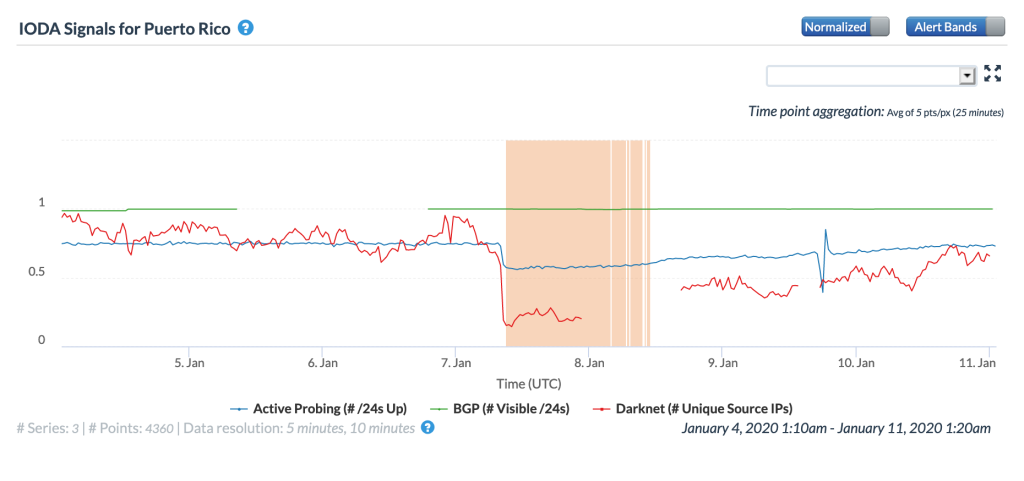
CAIDA IODA graph for Puerto Rico, January 7-10 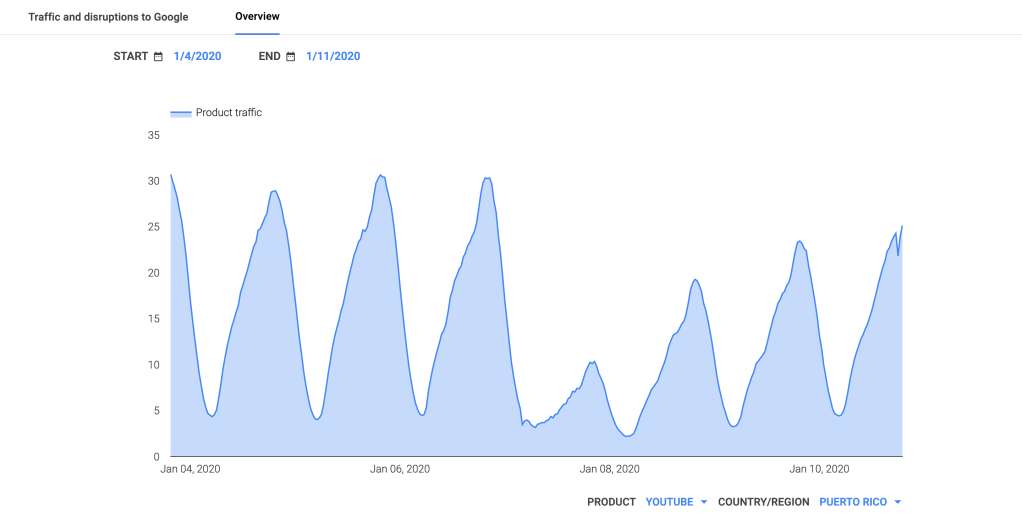
Google Transparency Report traffic graph for Puerto Rico, January 7-10
The figures below illustrate the impact of the earthquake on three local fixed connectivity providers. The impact to active probing measurements appears to be similar across both the Oracle Internet Intelligence and CAIDA IODA graphs. However, it is interesting to note that the CAIDA Darknet metric shows a severe drop at the time the earthquake occurs, reflecting a significant loss of connectivity to those systems connecting to the darknet address space.
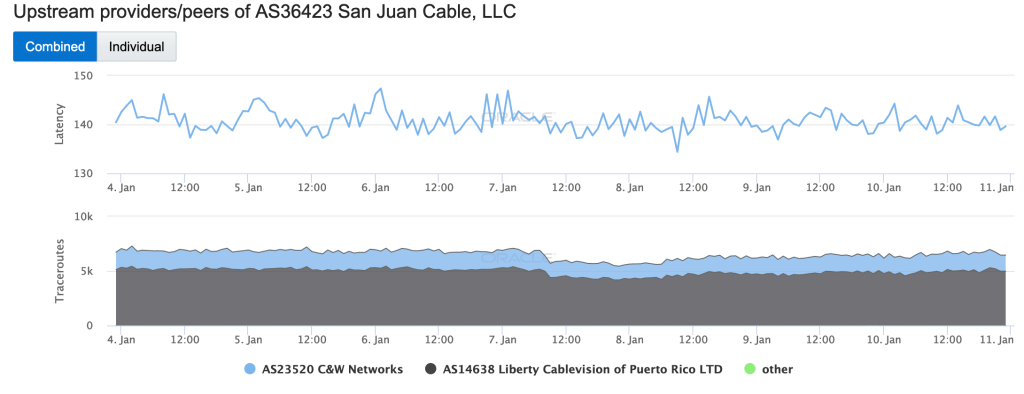
Oracle Internet Intelligence Traffic Shifts graph for AS36423 (San Juan Cable), January 7-10 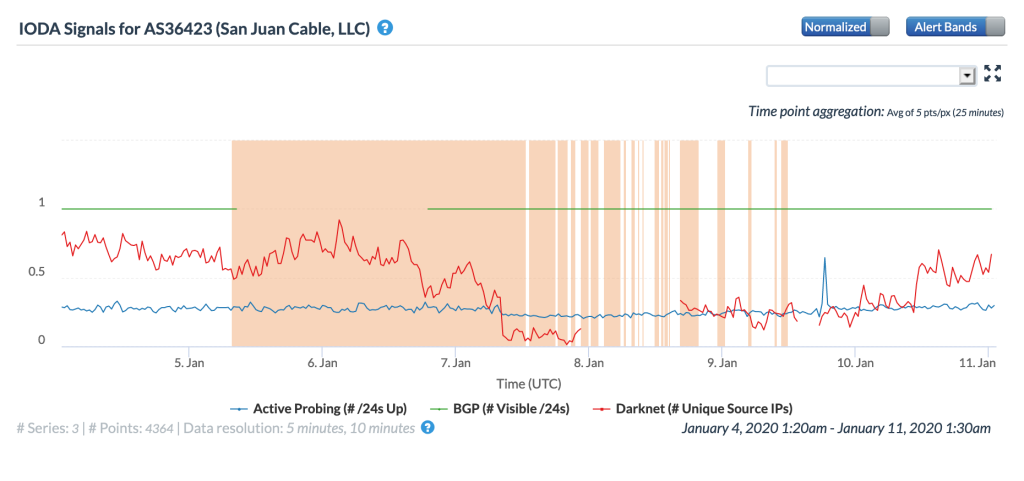
CAIDA IODA graph for AS36423 (San Juan Cable), January 7-10
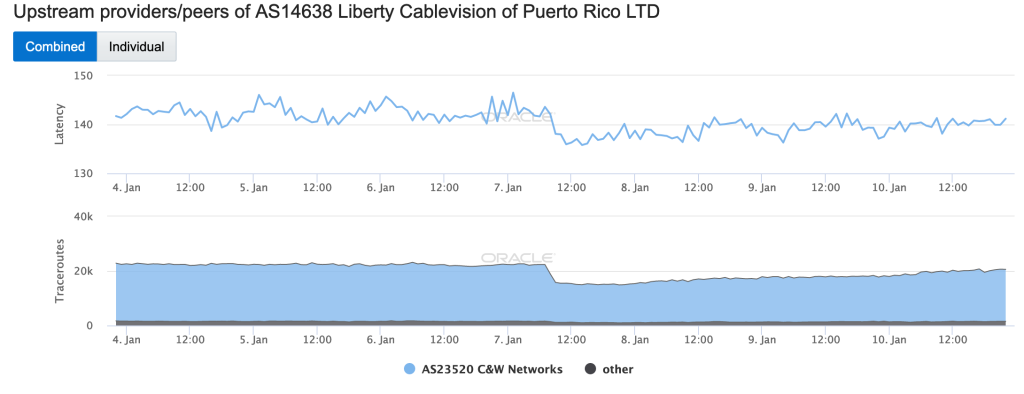
Oracle Internet Intelligence Traffic Shifts graph for AS14636 (Liberty Cablevision), January 7-10 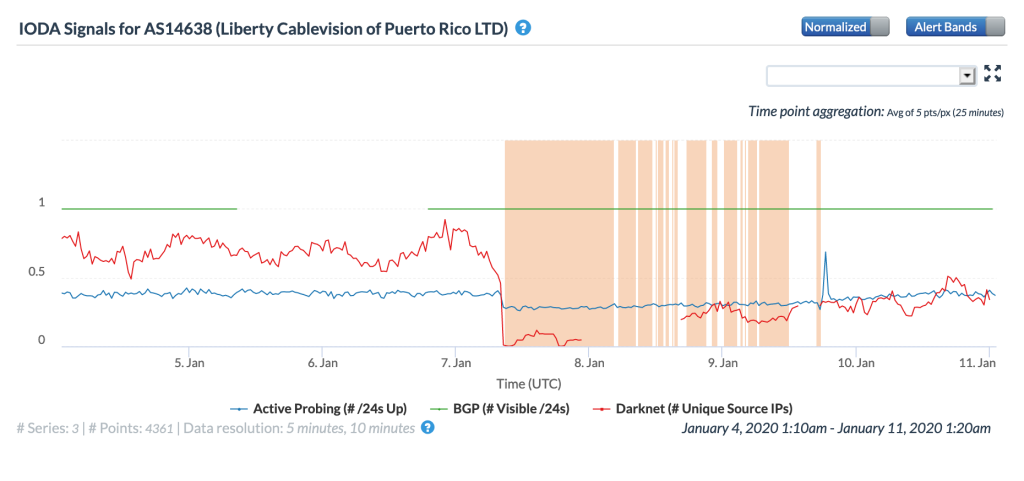
CAIDA IODA graph for AS14638 (Liberty Cablevision), January 7-10
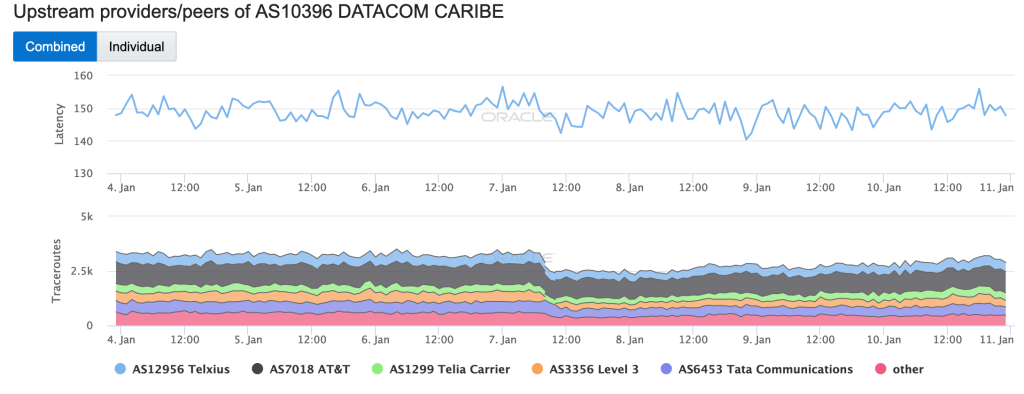
Oracle Internet Intelligence Traffic Shifts graph for AS10396 (Datacom Caribe), January 7-10 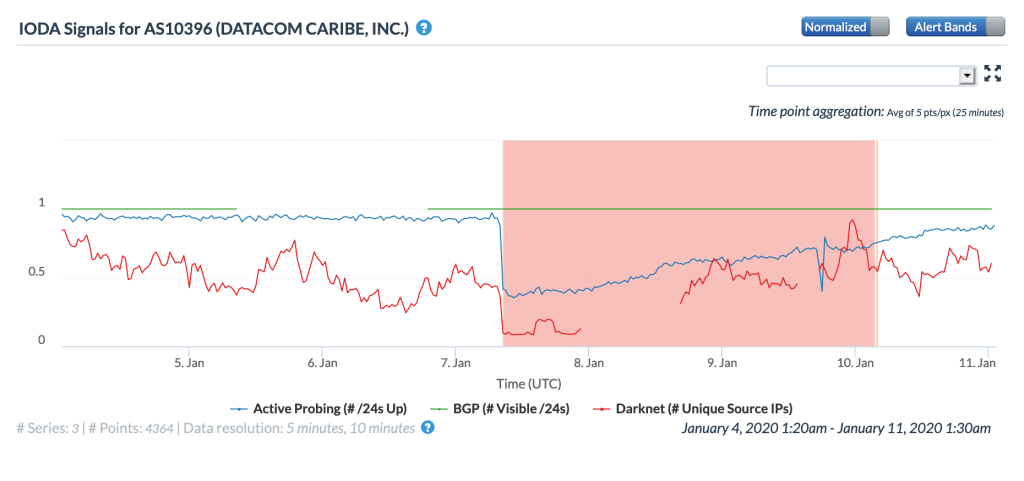
CAIDA IODA graph for AS10396 (Datacom Caribe), January 7-10
The figures below illustrate the impact of the earthquake on three local wireless connectivity providers. As would be expected, the impacts observed through these external measurements appear to be less notable than the impacts to the fixed providers. Although many mobile customers may have lost connectivity, external measurement into wireless networks is challenging due to the network architecture, leading to a more limited perspective.
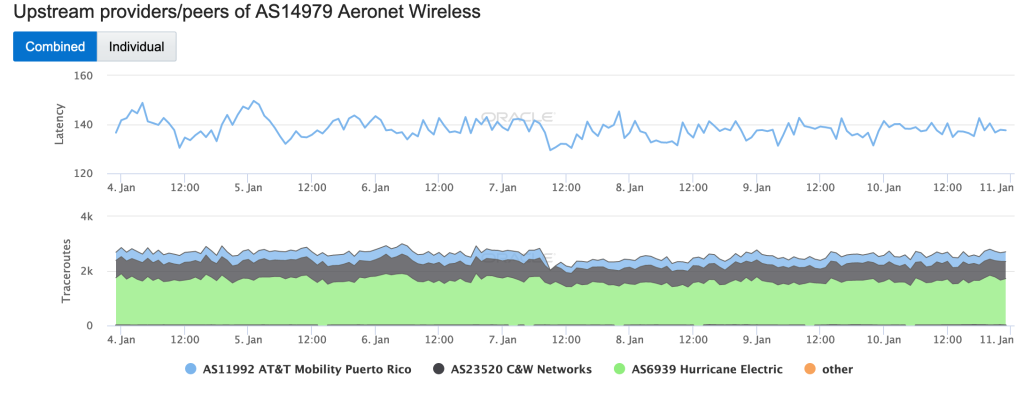
Oracle Internet Intelligence Traffic Shifts graph for AS14979 (Aeronet Wireless), January 7-10 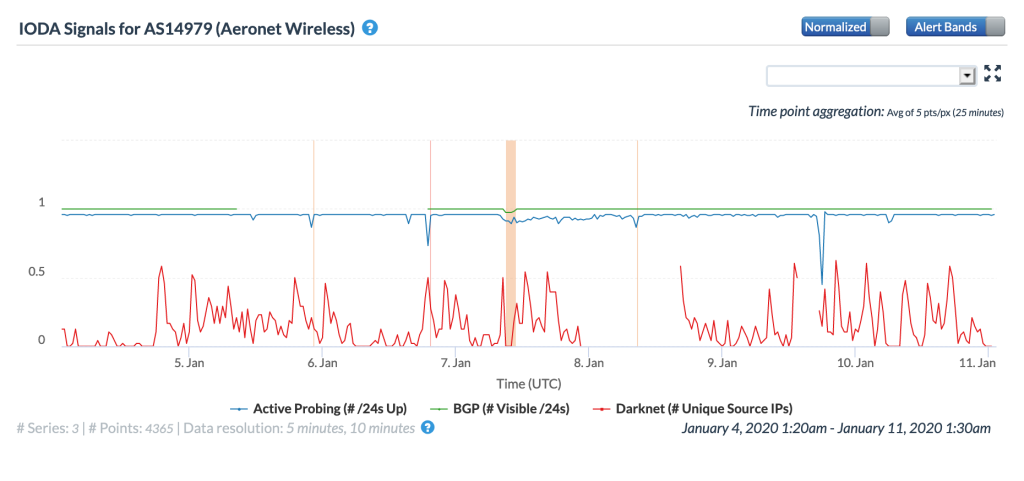
CAIDA IODA graph for AS14979 (Aeronet Wireless), January 7-10
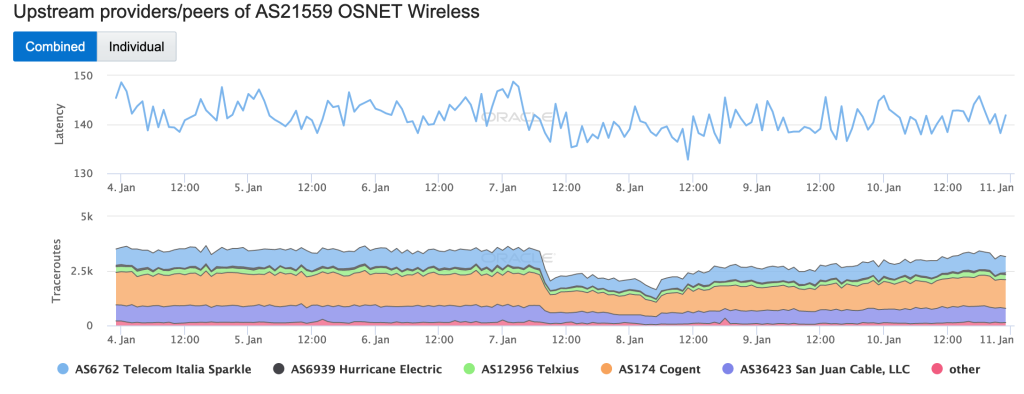
Oracle Internet Intelligence Traffic Shifts graph for AS21559 (OSNET Wireless), January 7-10 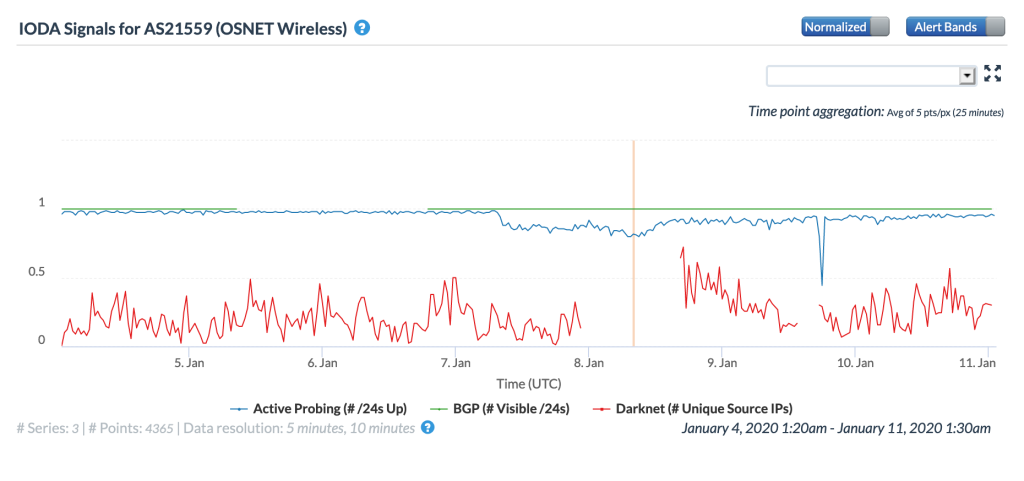
CAIDA IODA graph for AS21559 (OSNET Wireless), January 7-10

Oracle Internet Intelligence Traffic Shifts graph for AS11992 (AT&T Mobility), January 7-10 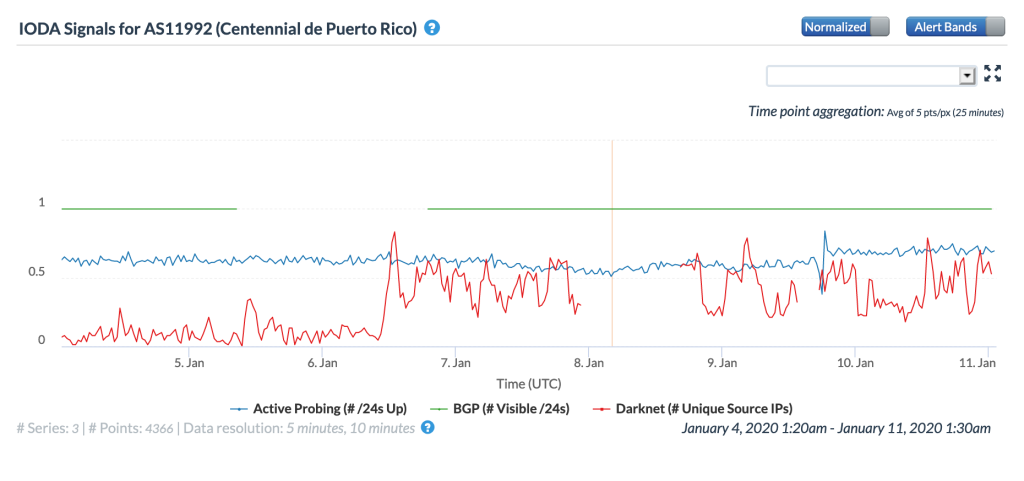
CAIDA IODA graph for AS11992 (AT&T Mobility), January 7-10
Power Outages
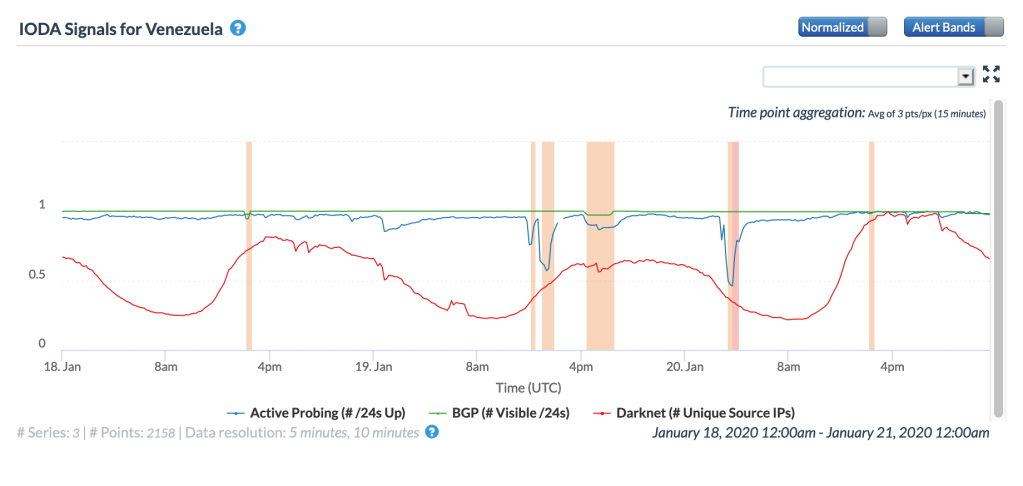
On January 18, Internet monitoring firm Netblocks Tweeted about a significant power outage impacting multiple states in Venezuela. The CAIDA IODA figures below show an Internet disruption occurring just after midnight GMT – given the time difference, this is roughly in alignment with Netblocks’ observations. The figures also show additional disruptions occurring mid-day (GMT) on January 19, as well as another one early on January 20. It isn’t known whether these additional two issues are also related to power outages, although it is likely.
Just a few days later, on January 22, Netblocks Tweeted about another major power that knocked out Internet connectivity across multiple states in Venezuela. In the Oracle Internet Intelligence and CAIDA IODA graphs below, the disruption is visible as a brief drop in the active probing metric around 00:00 GMT on January 23 (again, due to the time difference).
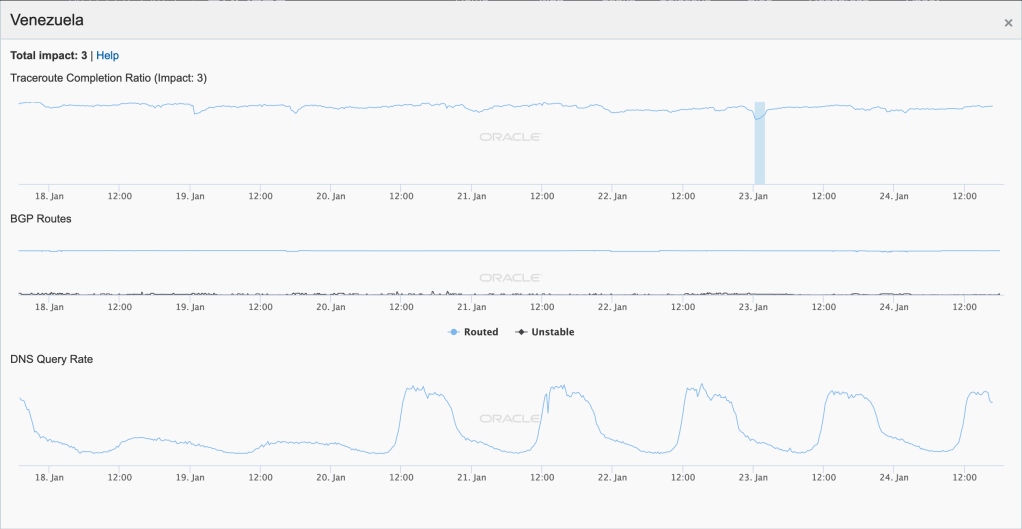
Oracle Internet Intelligence Map Traffic Statistics graph for Venezuela, January 22-23 
CAIDA IODA graph for Venezuela, January 22-23
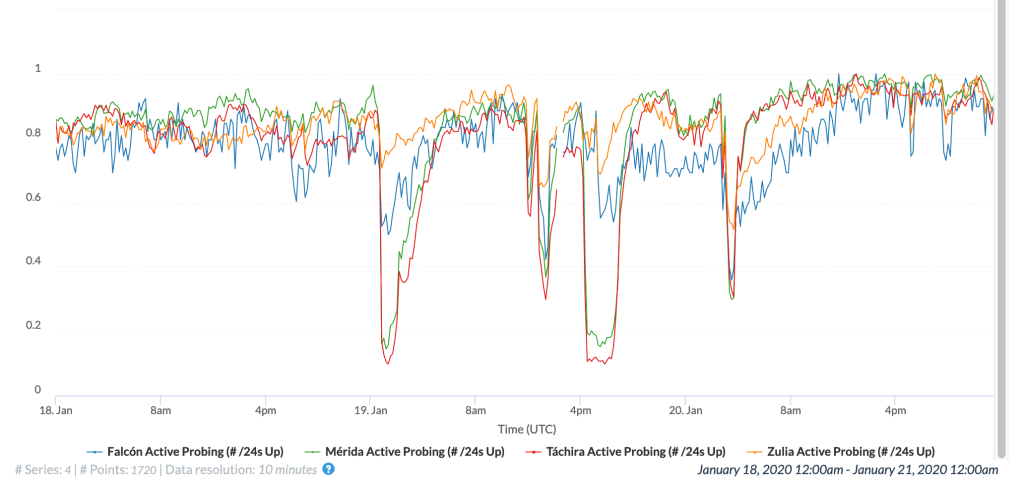
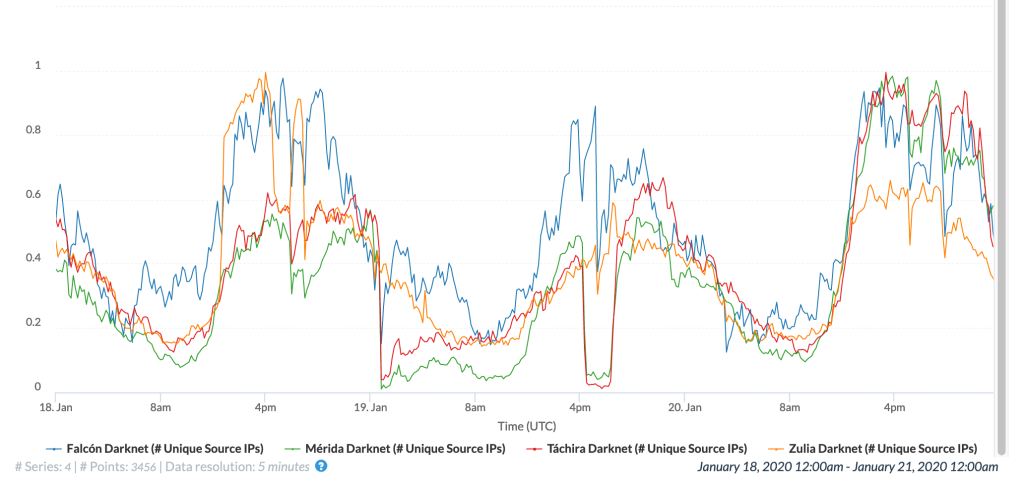
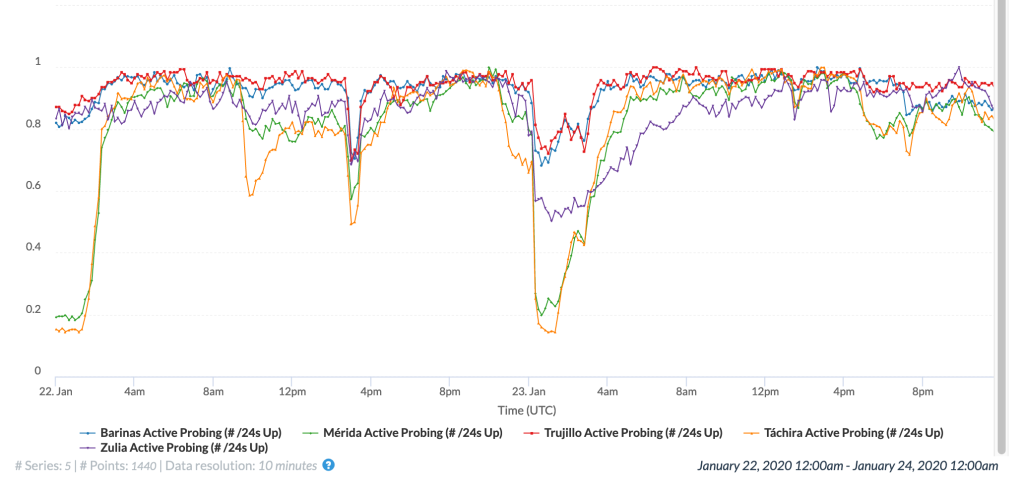
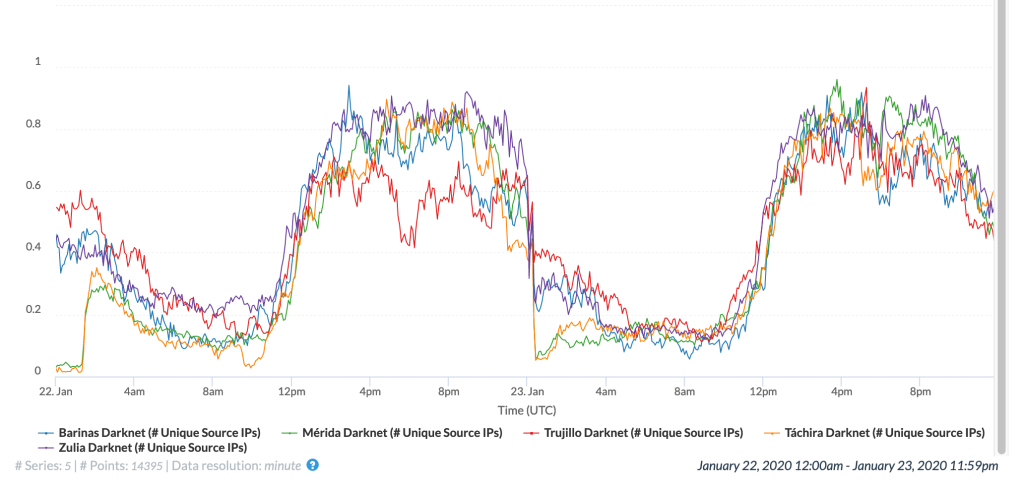
The CAIDA IODA figures below show the impact observed for five of the affected states. While the disruption is visible across all five, it appears that connectivity dropped most significantly in Mérida, Táchira, and Zulia.
Network Maintenance
Mid-afternoon (GMT) on January 8, a brief disruption to Internet connectivity occurred on the South Pacific island nation of Vanuatu. As seen in the Oracle Internet Intelligence and CAIDA IODA graphs below, the disruption impacted both the active probing and BGP metrics, starting around 13:00 GMT, lasting around 45 minutes.
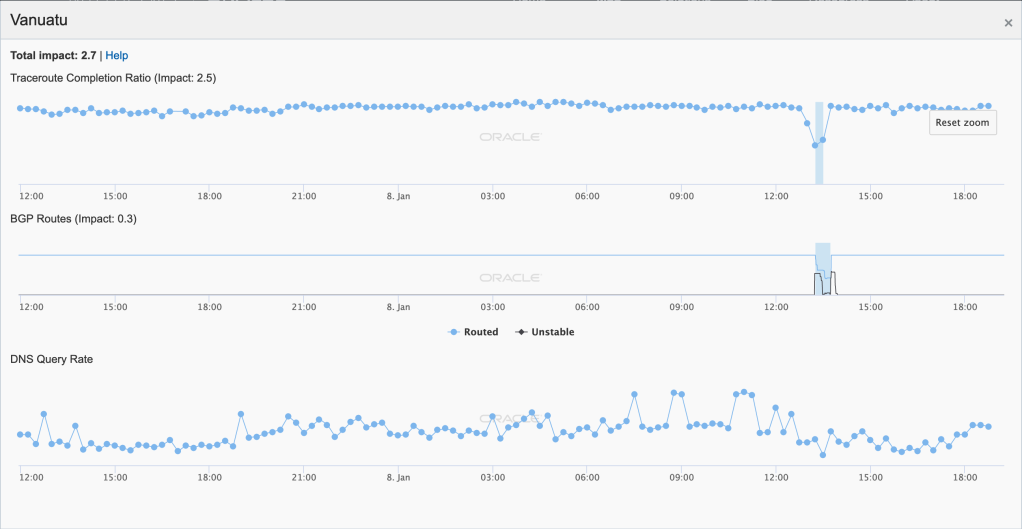
Oracle Internet Intelligence Map Country Statistics graph for Vanuatu, January 8 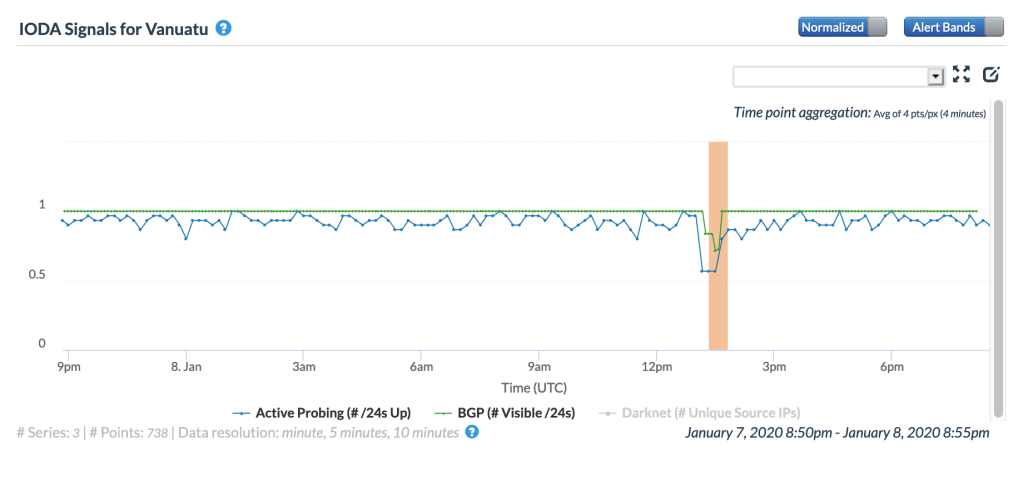
CAIDA IODA graph for Vanuatu, January 8
Digging in further, the problem appeared to be related to a disruption at Telecom Vanuatu. According to an e-mail from a contact at the provider, the disruption was related to a planned maintenance activity on their uplink interface.
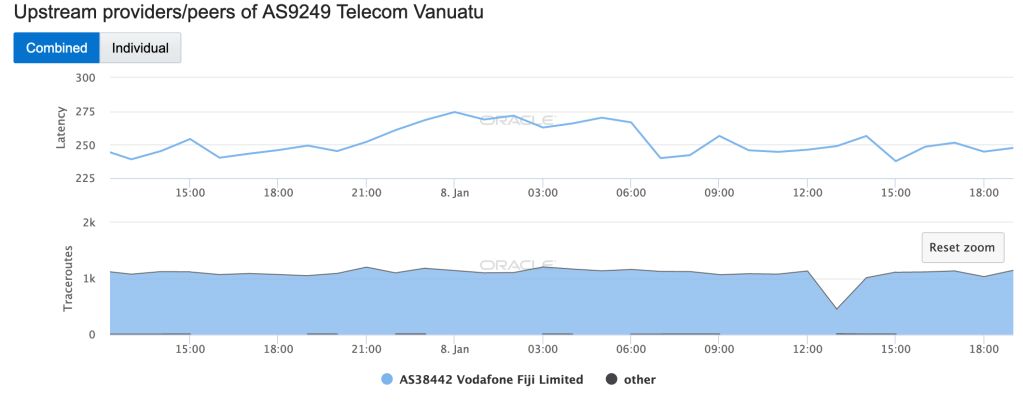
Oracle Internet Intelligence Map Traffic Shifts graph for AS9249 (Telecom Vanuatu), January 8 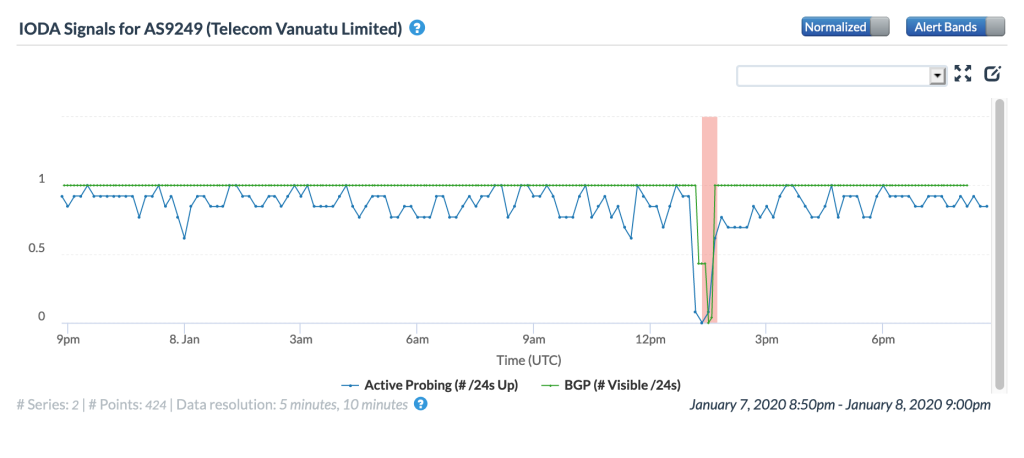
CAIDA IODA graph for AS9249 (Telecom Vanuatu), January 8
Late on January 27 into early January 28 (GMT), a significant Internet disruption was detected in Samoa. As shown in the country-level figures below, Oracle’s active probing metric dropped to about half its previous level, while CAIDA’s dropped to near zero. The BGP metric across both Oracle Internet Intelligence and CAIDA IODA measurements saw multiple oscillations during the period of disruption.
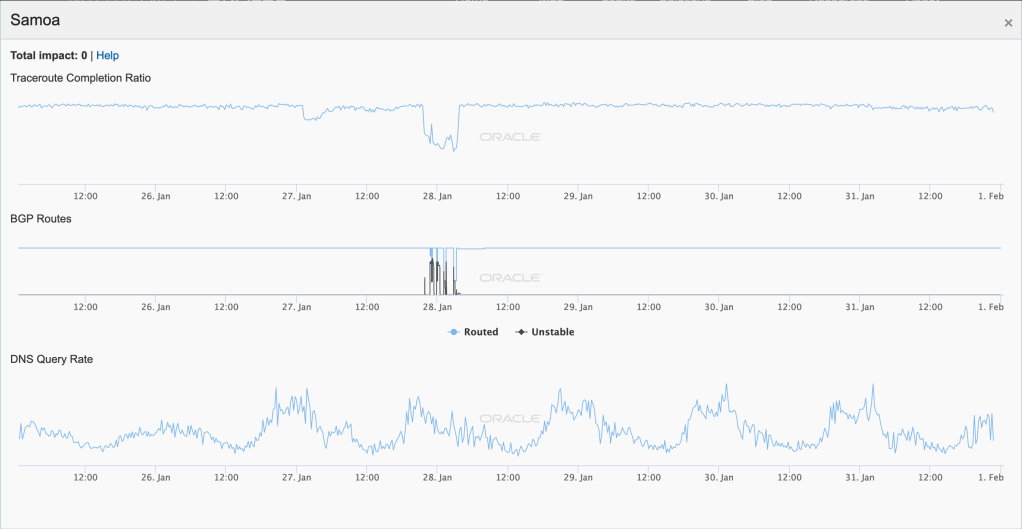
Oracle Internet Intelligence Map Country Statistics graph for Samoa, January 27-28 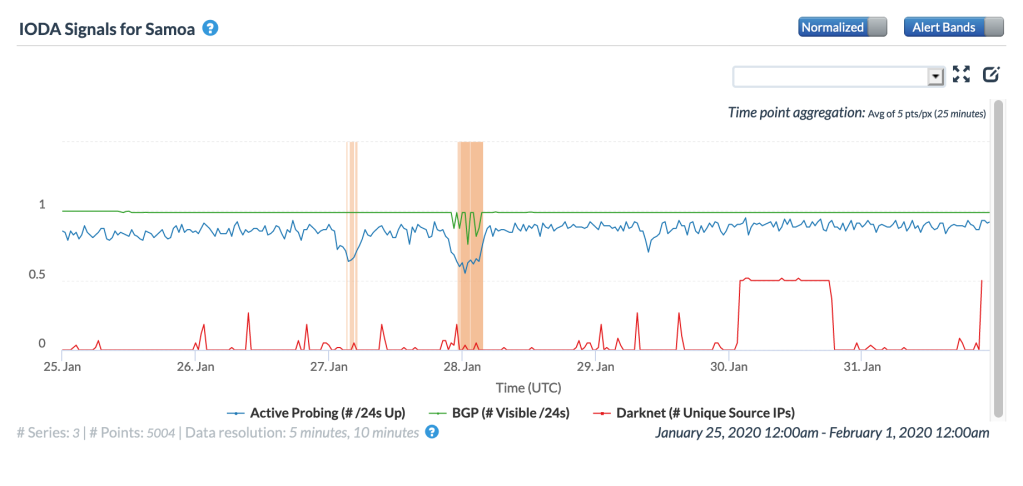
CAIDA IODA graph for Samoa, January 27-28
As noted in the Facebook update from Samoa Bluesky (SamoaTel) above, they experienced an issue with their “gateway”, impacting service availability. The graphs below show the impact of this issue on on Samoa Bluesky’s network. The Oracle Internet Intelligence graphs show that latency to the network spiked during the disruption, indicating that the few measurements that did complete successfully did so over a much slower path.
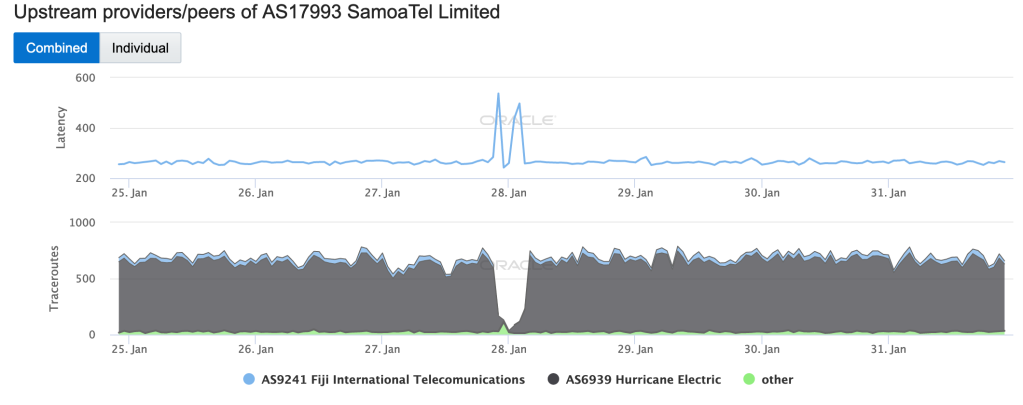
Oracle Internet Intelligence Map Traffic Shifts graph for AS17993 (SamoaTel), January 27-28 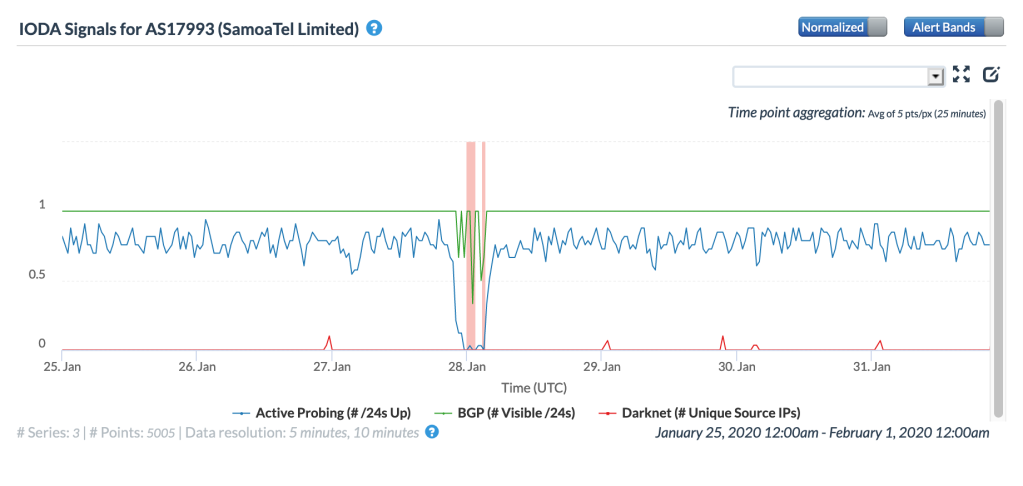
CAIDA IODA graph for AS17993 (SamoaTel), January 27-28
Government Directed
Iran is no stranger to government-directed Internet shutdowns, and in mid-January, two more occurred in response to protests for those killed on Flight PS752, the Ukraine International Airlines plane that was reportedly shot down on January 8 by Iran’s Islamic Revolutionary Guard Corps.
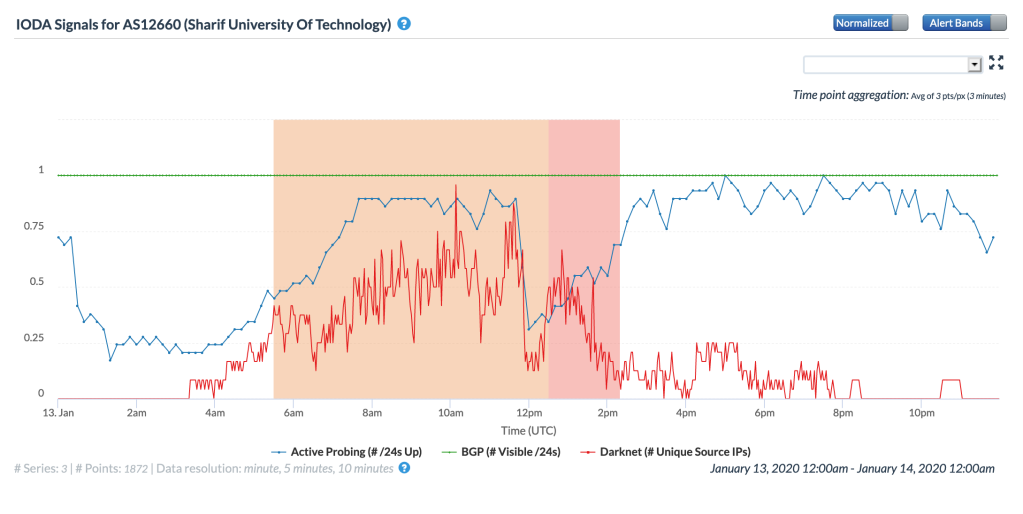
A Tweet from Netblocks on January 13 highlighted an Internet disruption detected at Sharif University of Technology in Tehran, starting just before noon UTC, and noted that students were protesting at the university for colleagues and alumni killed on the flight. The disruption can be seen in the CAIDA IODA graph below, with both the Active Probing and Darknet metrics dropping significantly around noon. The Active Probing metric recovered after several hours, while the Darknet metric recovered to continue what was likely a diurnal decline.
A day later, another Internet disruption was observed in Iran by Netblocks and by CAIDA IODA, beginning just before 14:00 GMT. In the country-level graphs below, the disruption is most evident in the active probing metrics from both Oracle Internet Intelligence and CAIDA IODA, and is clear in CAIDA’s Darknet metric as well.
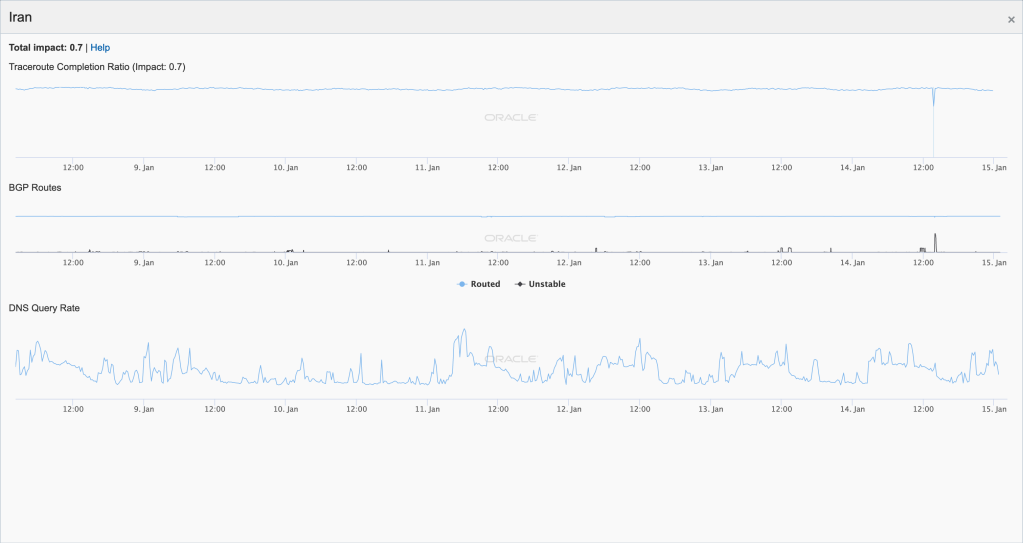
Oracle Internet Intelligence Map Country Statistics graph for Iran, January 14 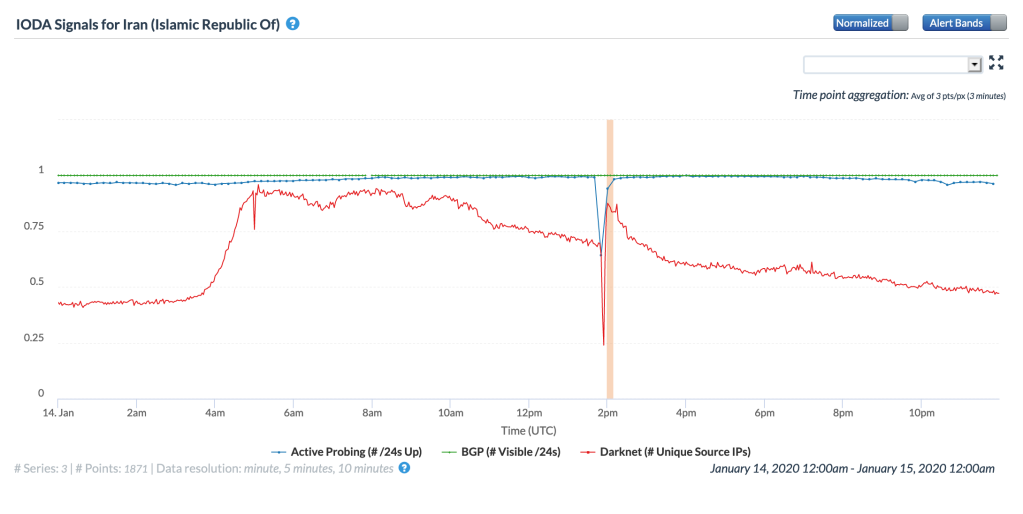
CAIDA IODA graph for Iran, January 14
Similar impacts can also be seen in the three CAIDA network-level graphs below, with sharp but brief declines seen in the Active Probing and Darknet metrics across three leading Iranian telecommunications firms.
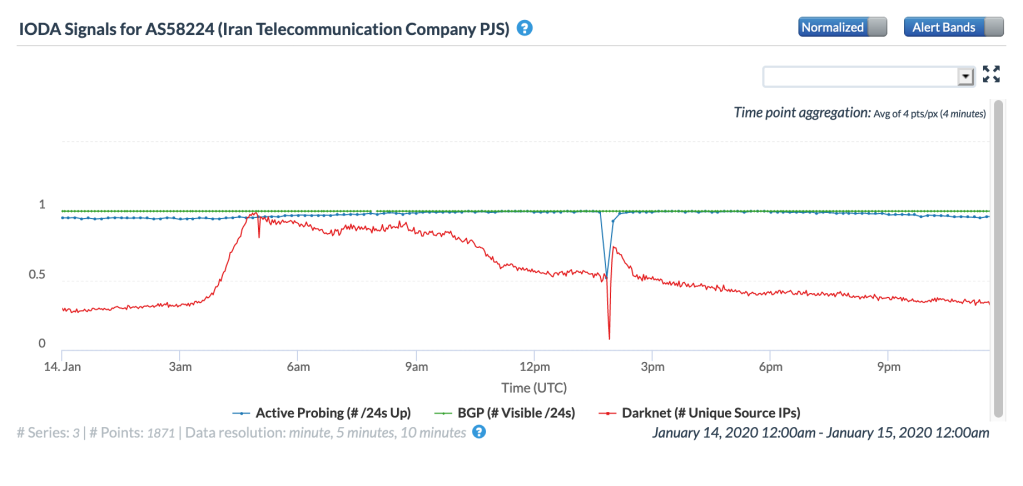
CAIDA IODA graph for AS58224 (TCI), January 14 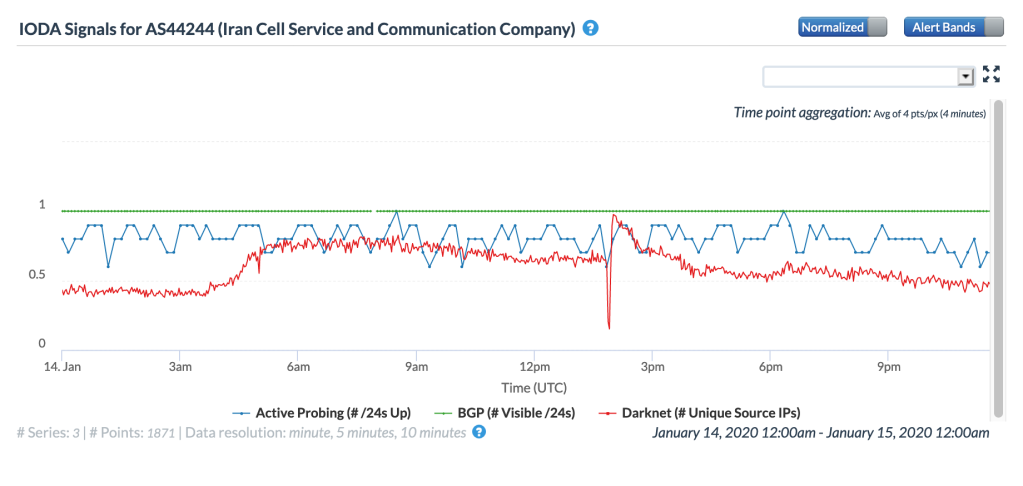
CAIDA IODA graph for AS44244 (Iran Cell), January 14 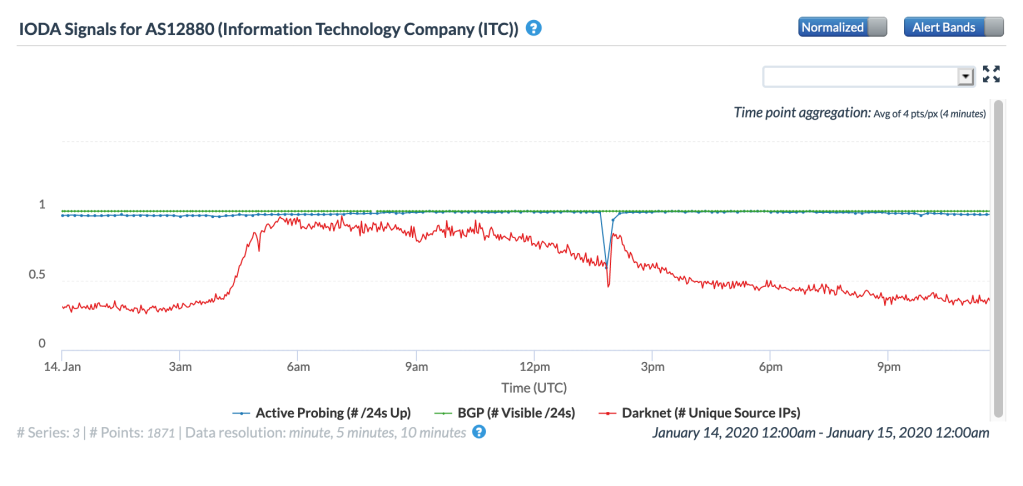
CAIDA IODA graph for AS12880 (TIC), January 14
Cable Cuts
January saw several major cable cuts that had significant and wide ranging impacts.
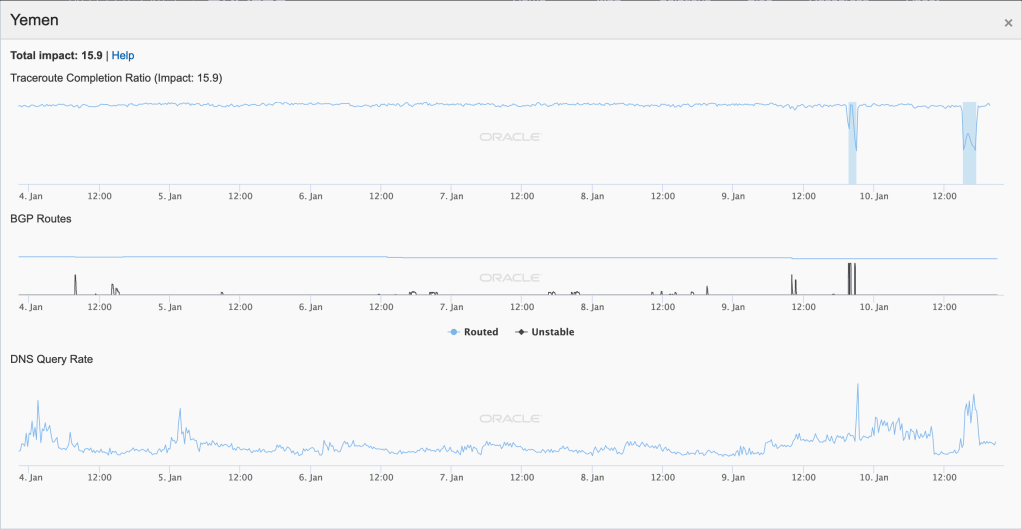
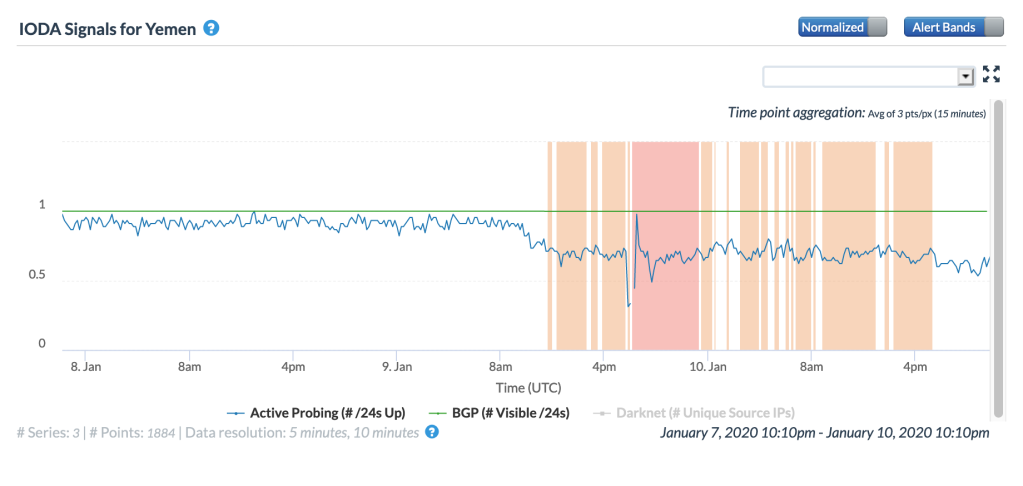
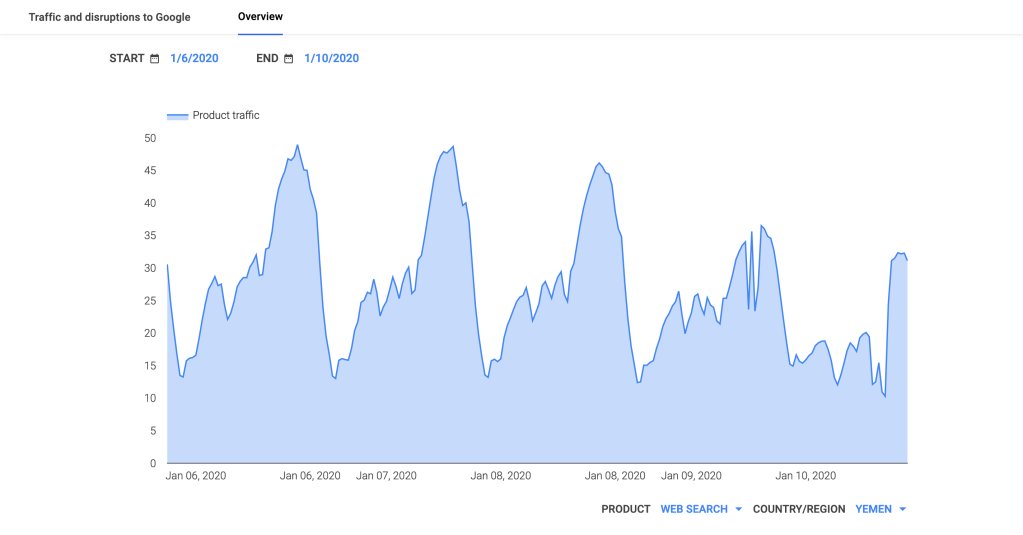
The first was observed in Yemen on January 9. In the figures below, a significant disruption can be seen in Oracle’s and CAIDA’s active probing metrics and in Google Web search traffic for Yemen around 18:00 GMT, but were preceded by a gradual decline beginning around 09:00 GMT. Initial indication that the disruption was due to a cable cut reportedly came from an SMS message from Yemen’s national Internet service provider to its users.
Oracle Internet Intelligence Tweeted confirmation of the disruption, showing the impact to YemenNet, and the provider posted the update shown below to its Facebook page, noting that the disruption was caused by a problem with the FALCON submarine cable, owned by Global Cloud Xchange. (English translation of the post via Facebook.)
More than 80 % of international internet hours in Yemen have been released as a result of an international cable outage outside Yemen
Sana ‘ a January 2020, 9 (Spa)-General announced that more than 80 % of international internet hours in Yemen were out of service as a result of an international cable outage outside Yemen.
The responsible source of the company and company of the Yemeni news agency / spa explained that a large number of internet links were out of service due to the exposure of the sea cable falcon in Suez, causing more than 80 percent of internet hours International in Yemen.
The source explained that there are ongoing efforts to follow up on cable repair and return of service soon.
The figures below show the impact on two of YemenNet’s autonomous systems, with the disruption affecting connectivity to AS30873 significantly more than AS12486. The Oracle Internet Intelligence graphs show that when the cable cut occurred and upstream connectivity to AS15412 (Global Cloud Xchange) was lost, YemenNet was able to quickly fail over to backup/alternate upstream providers
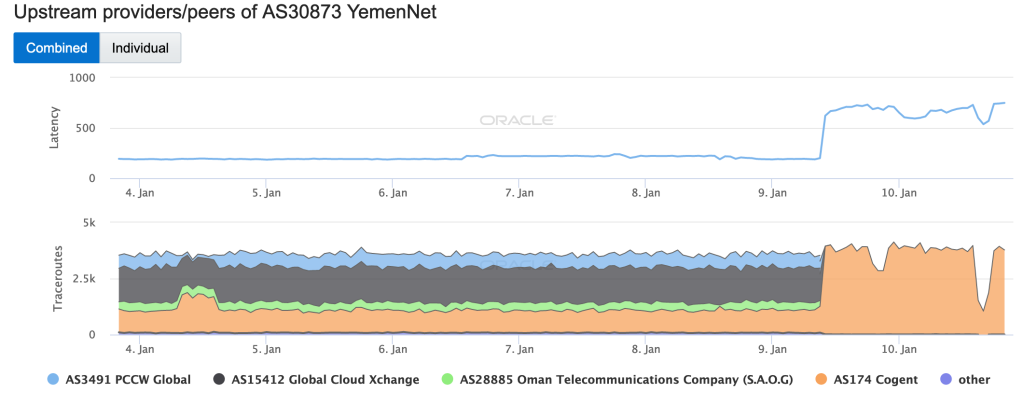
Oracle Internet Intelligence Map Traffic Shifts graph for AS30873 (YemenNet) , January 9 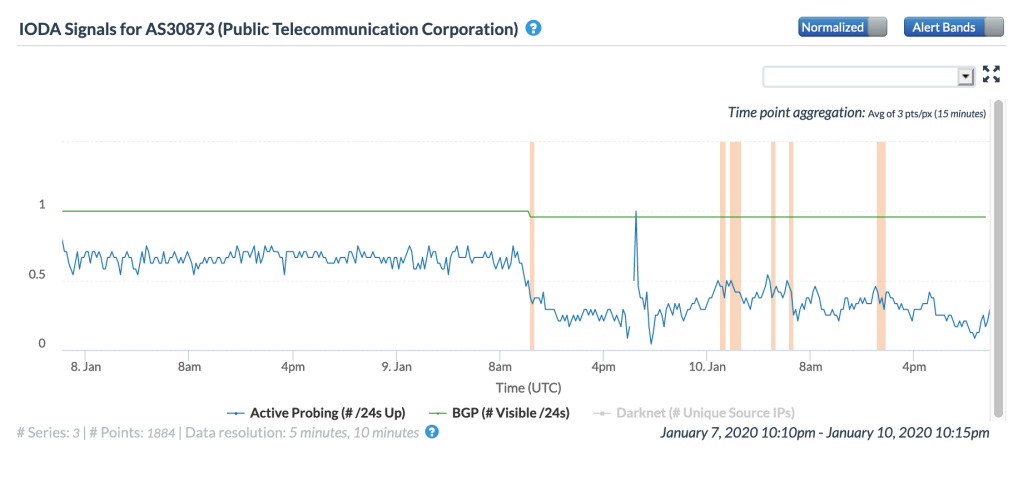
CAIDA IODA graph for AS30873 (YemenNet), January 9 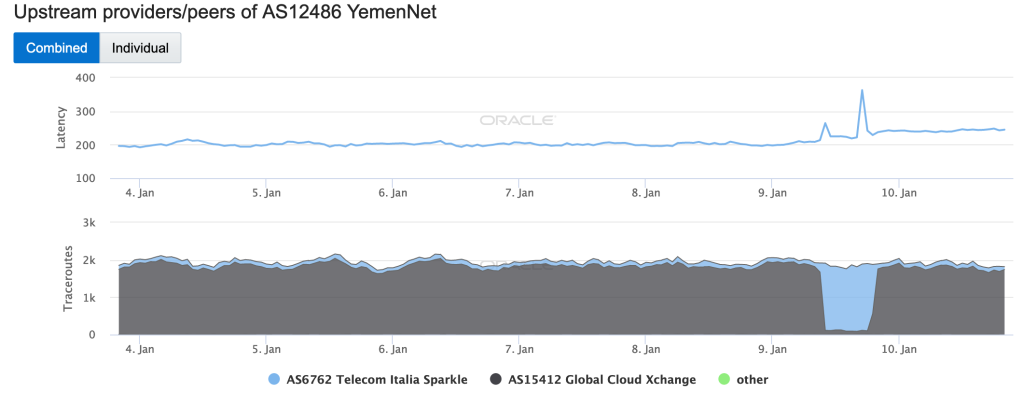
Oracle Internet Intelligence Map Traffic Shifts graph for AS12486 (YemenNet) , January 9 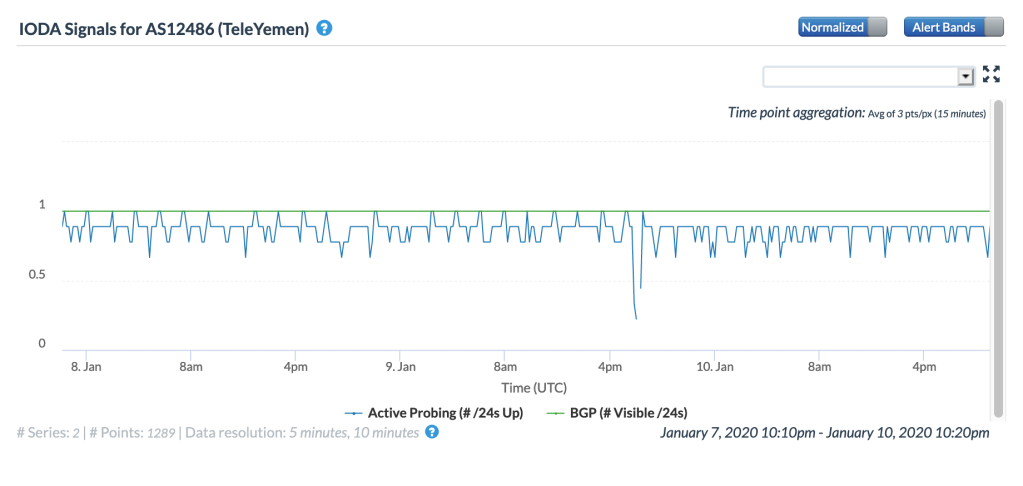
CAIDA IODA graph for AS12486 (YemenNet), January 9
The damage to the FALCON cable also impacted networks in a number of additional countries, including Comoros, Ethiopia, Kuwait, Tanzania, Saudi Arabia, and Sudan. The cable cut is evident in the CAIDA graphs below as a brief drop in the active probing metric. However, the impact is more pronounced in the Oracle Internet Intelligence graphs, where it resulted in increased latency concurrent with traffic shifting to alternate providers.
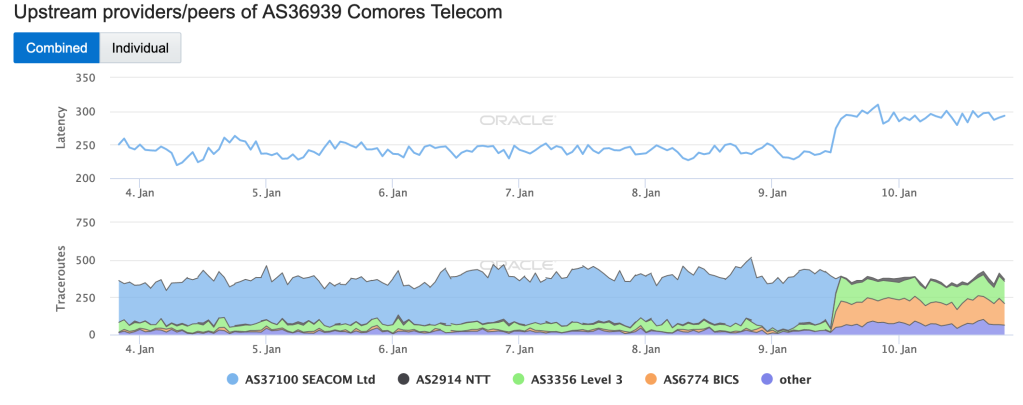
Oracle Internet Intelligence Map Traffic Shifts graph for AS36939 (Comores Telecom) , January 9 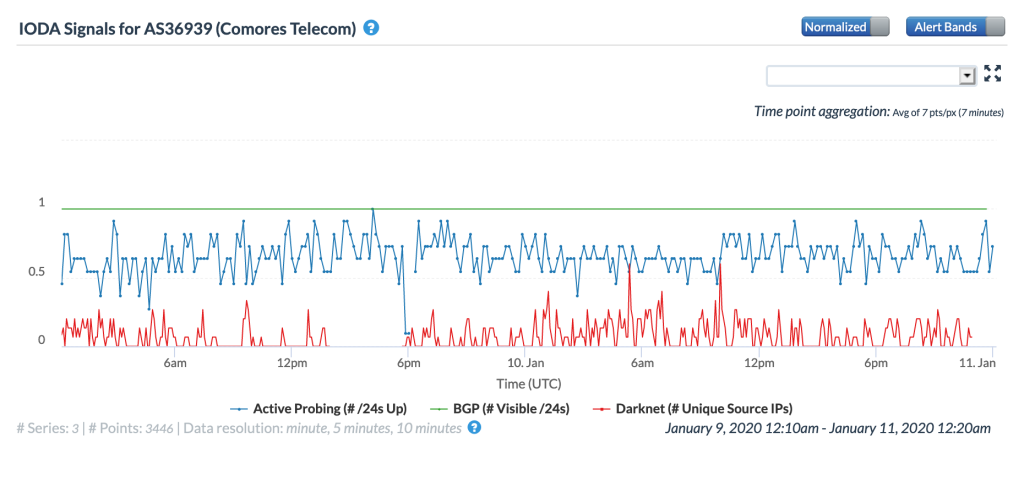
CAIDA IODA graph for AS36939 (Comores Telecom), January 9
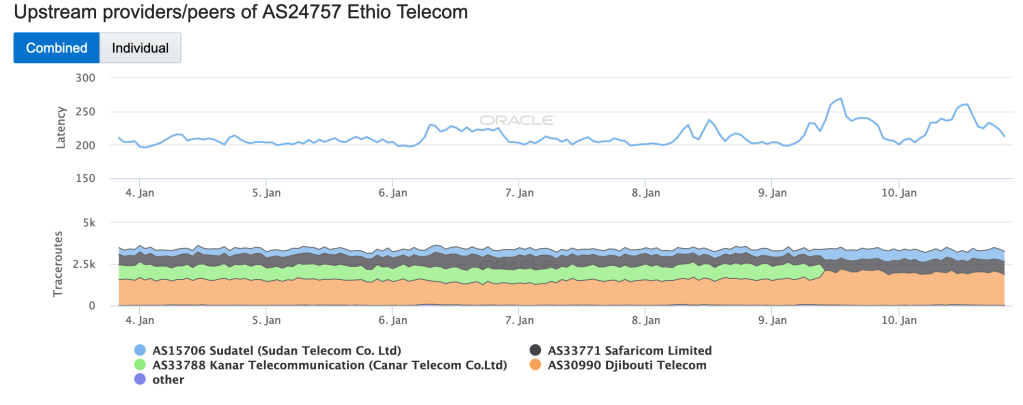
Oracle Internet Intelligence Map Traffic Shifts graph for AS24757 (Ethio Telecom), January 9 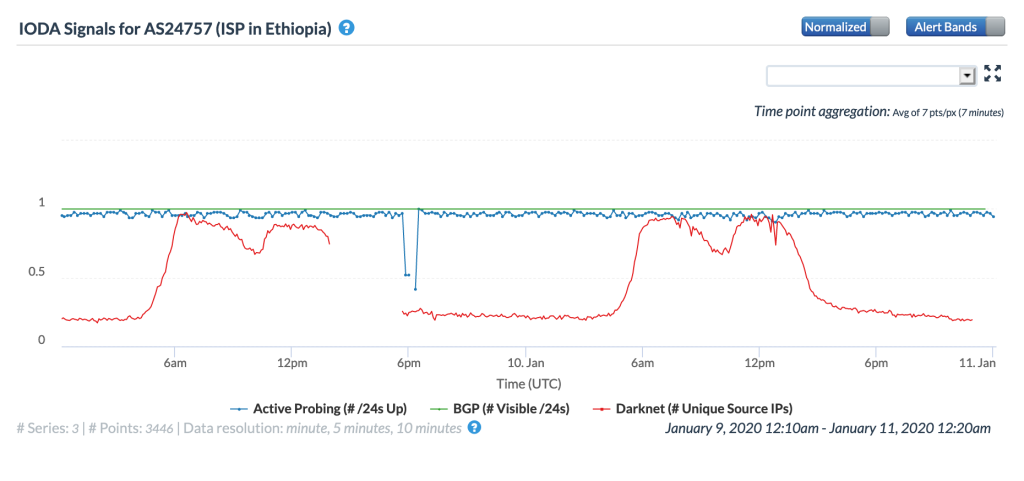
CAIDA IODA graph for AS24757 (Ethio Telecom), January 9
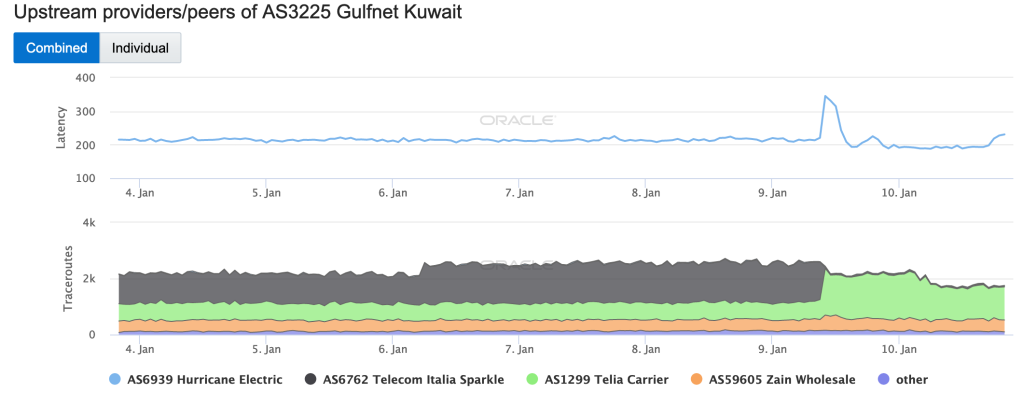
Oracle Internet Intelligence Map Traffic Shifts graph for AS3225 (Gulfnet Kuwait), January 9 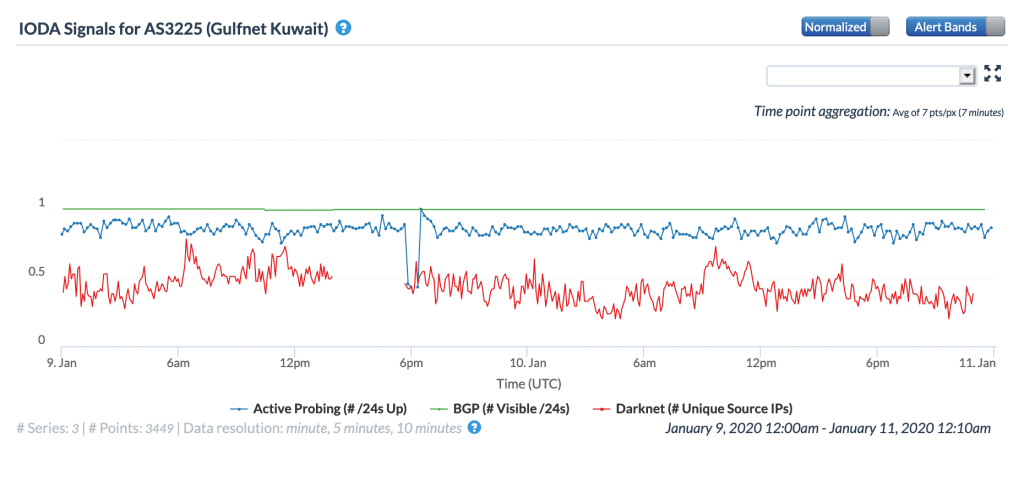
CAIDA IODA graph for AS3225 (Gulfnet Kuwait), January 9
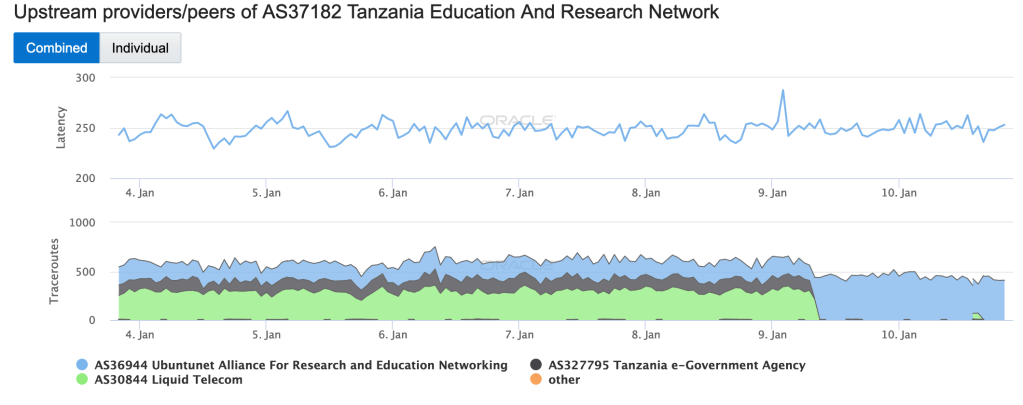
Oracle Internet Intelligence Map Traffic Shifts graph for AS37182 (Tanzania ERN), January 9 
CAIDA IODA graph for AS37182 (Tanzania ERN), January 9
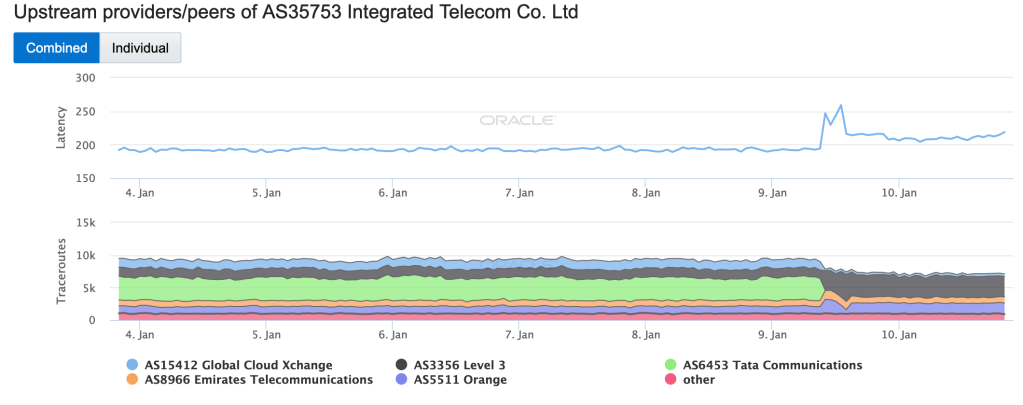
Oracle Internet Intelligence Map Traffic Shifts graph for AS35753 (Integrated Telecom), January 9 
CAIDA IODA graph for AS35753 (Integrated Telecom), January 9
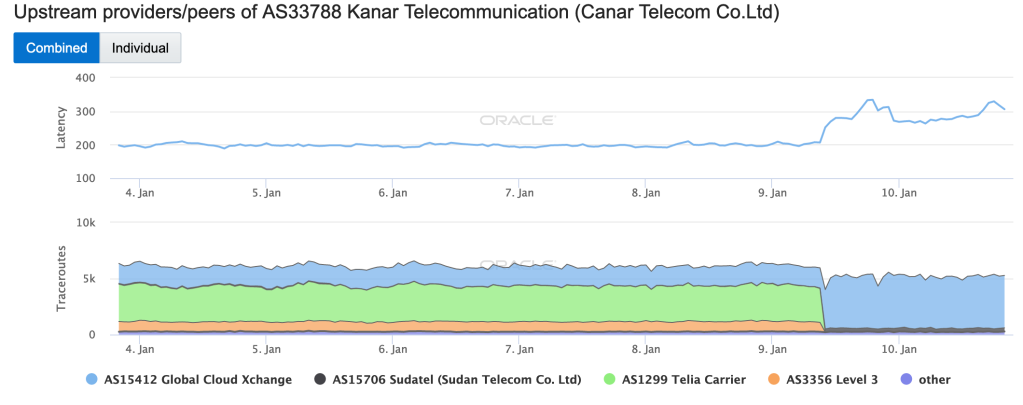
Oracle Internet Intelligence Map Traffic Shifts graph for AS33788 (Canar Telecom), January 9 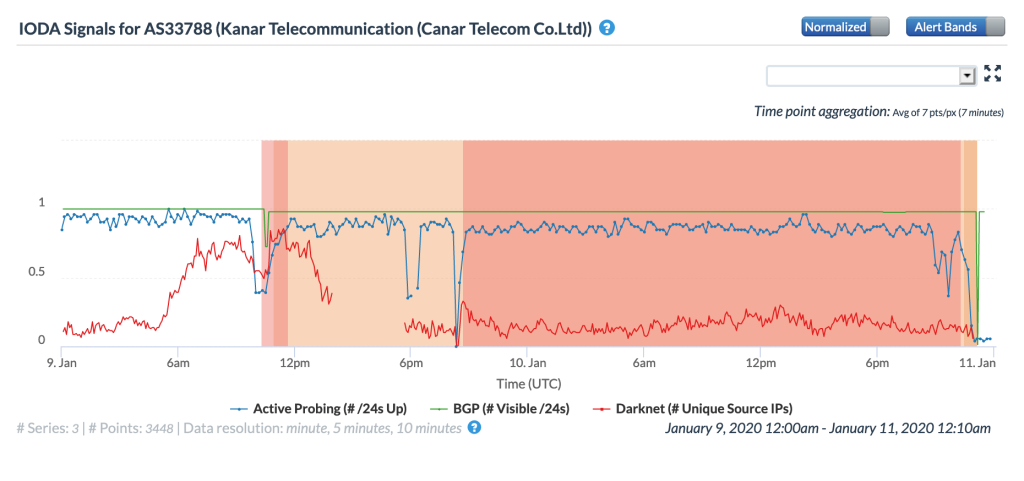
CAIDA IODA graph for AS33788 (Canar Telecom), January 9
On January 12, Global Cloud Xchange posted an update confirming the damage to the FALCON cable, and noting that the FLAG Europe-Asia (FEA) cable had also been damaged. It stated that “Initial findings indicate that probable cause was an anchor drag by a large merchant vessel in the immediate area.” Just over a month later, Global Cloud Xchange posted another update, announcing the that FALCON submarine cable had been repaired in “record time”, with connectivity restored by February 13. It expected repairs to the FEA cable to be completed by February 22.
Venezuelan telecommunications provider CANTV Tweeted on January 13 that it was working on restoring telephone and Internet services in the Anzoátegui, Bolívar, Monagas, Sucre and Delta Amacuro states. The CAIDA IODA figures below show the observed impact of the disruption to Internet connectivity for those states, with problems most visible in Bolívar, Monagas, and Delta Amacuro. While the Active Probing metric showed a decline, as would be expected, it is interesting to note that the BGP metric was also impacted, possibly indicating that connectivity to key local routing infrastructure was interrupted.
#13Ene Equipo técnico de #Cantv Región Oriente y Guayana realizaron las maniobras necesarias, para restituir servicios de telefonía fija e Internet en los estados Anzoátegui, Bolívar, Monagas, Sucre y Delta Amacuro. pic.twitter.com/PZ51s0jgiO
— SaladePrensaCantv (@salaprensaCantv) January 13, 2020
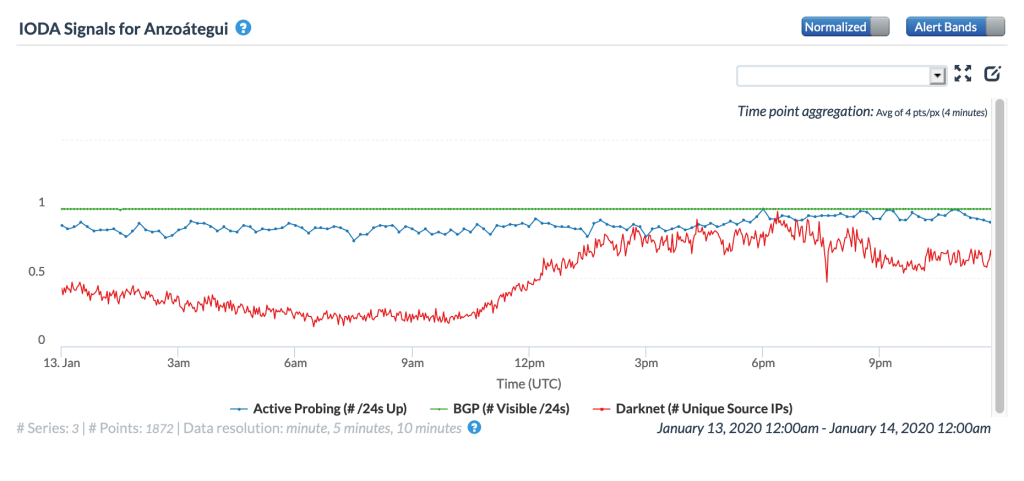
CAIDA IODA graph for Anzoátegui, Venezuela, January 13 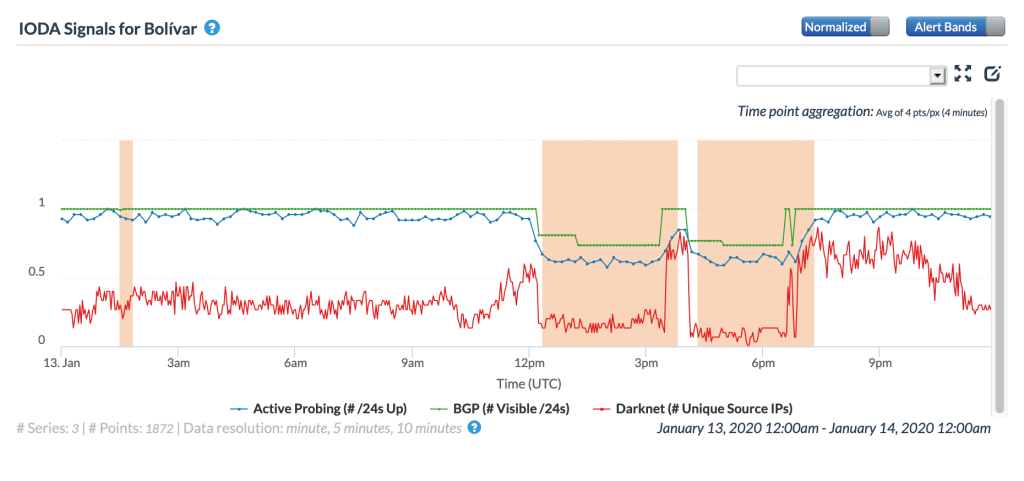
CAIDA IODA graph for Bolívar, Venezuela, January 13 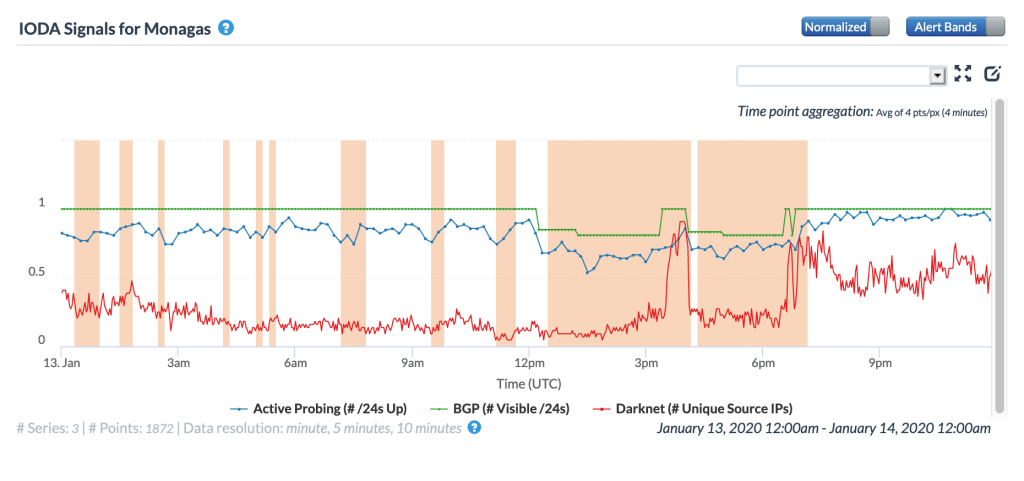
CAIDA IODA graph for Monagas, Venezuela, January 13 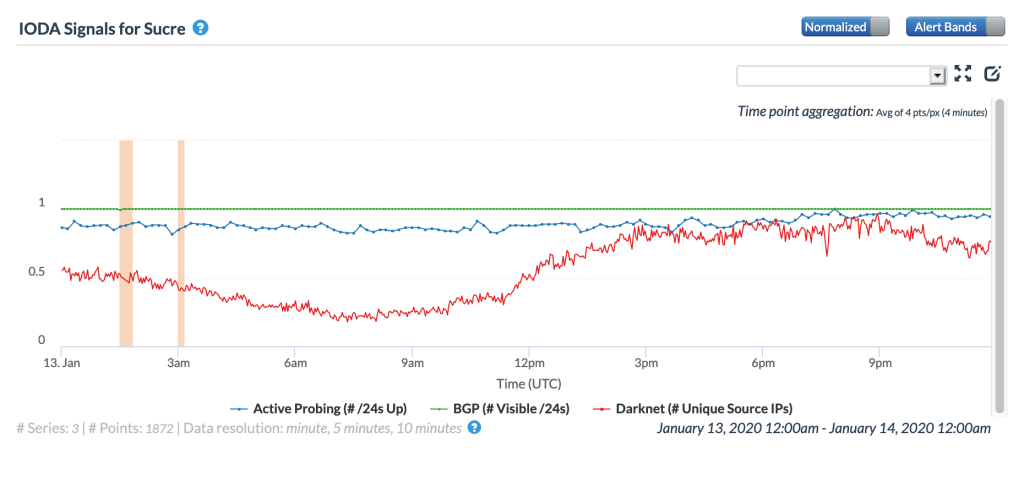
CAIDA IODA graph for Sucre, Venezuela, January 13 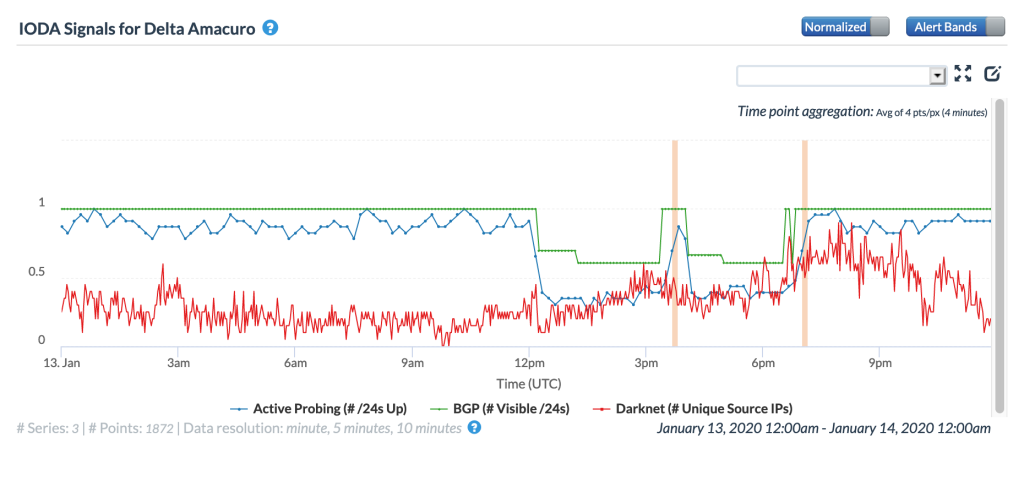
CAIDA IODA graph for Delta Amacuro, Venezuela, January 13
On January 16, Oracle Internet Intelligence Tweeted about a submarine cable outage that happened earlier that morning which severely degraded Internet connectivity for multiple countries along the west coast of Africa. Published reports (including ITWeb, SubTel Forum, and TechCentral) indicated that both the SAT-3/WASC and the West African Cable System (WACS) experienced breaks. The SAT-3/WASC break was reported to be in the vicinity of Libreville, Gabon, while the WACS break was reported to be in the vicinity of Luanda, Angola.
The damage to these submarine cables reportedly disrupted Internet connectivity to a number of African countries, including Angola, Cameroon, Congo, Democratic Republic of Congo, Gabon, the Gambia, Ghana, Ivory Coast, Mali, Mauritania, Namibia, Niger, Nigeria, South Africa, Zambia, and Zimbabwe. The figures below illustrate the impact as measured by Oracle Internet Intelligence and CAIDA IODA, and as seen through Google Web Search traffic from the affected countries.
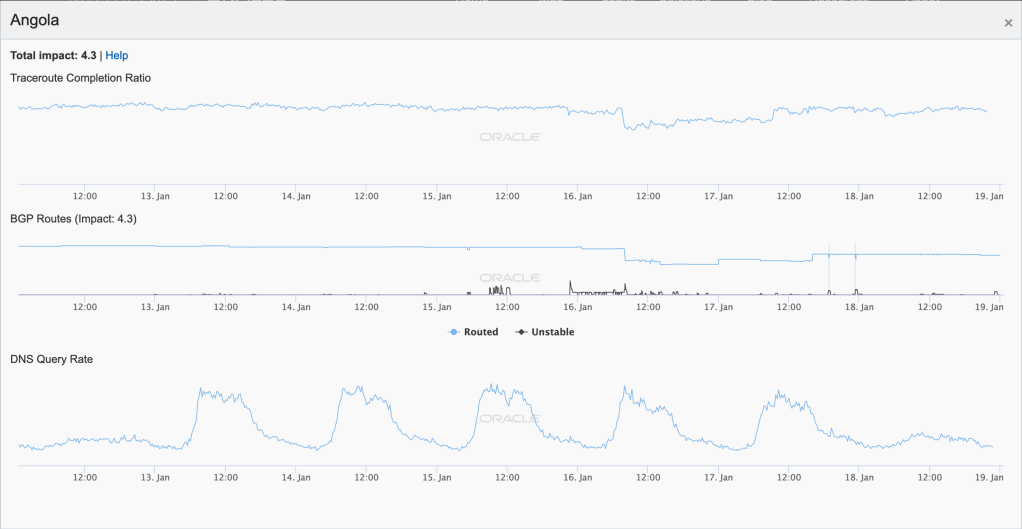
Oracle Internet Intelligence Map Country Statistics graph for Angola, January 16 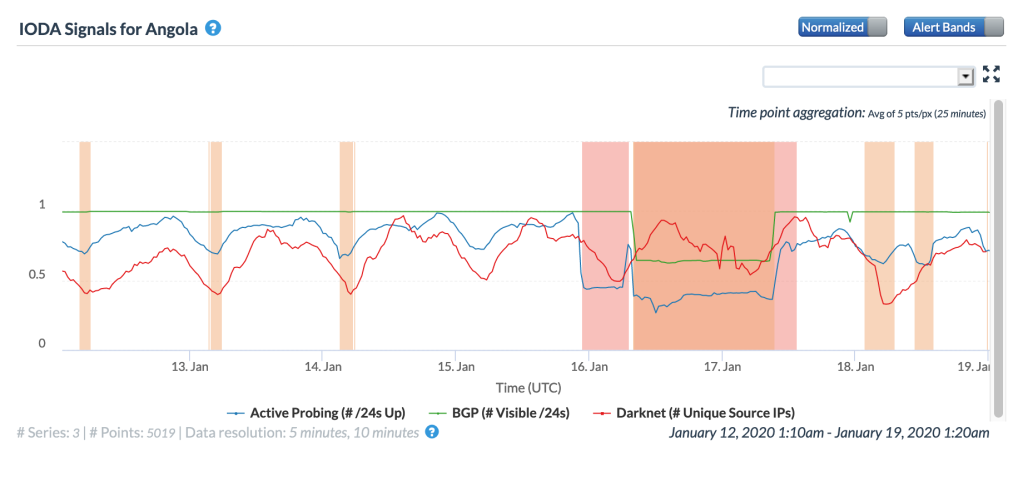
CAIDA IODA graph for Angola, January 16 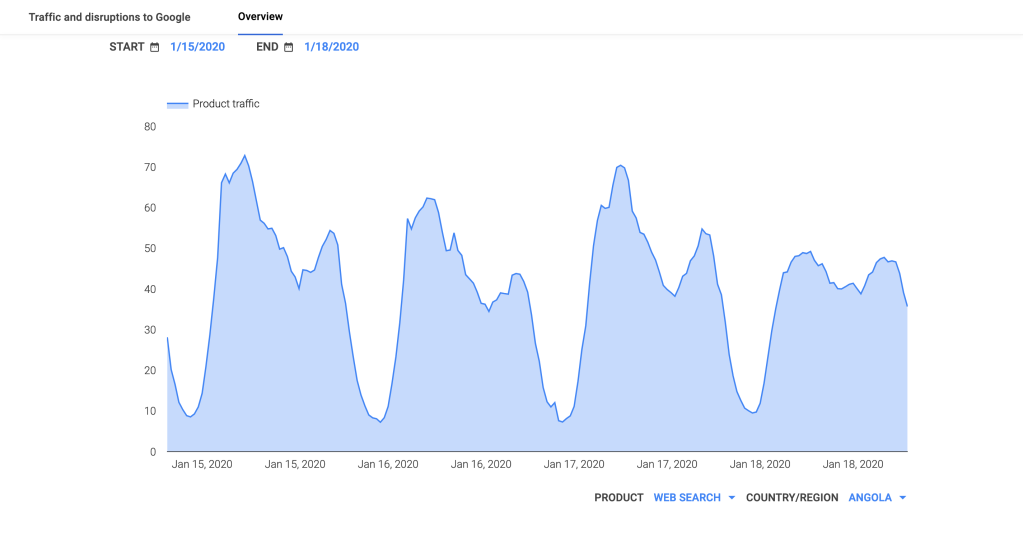
Google Transparency Report traffic graph for Angola, January 16
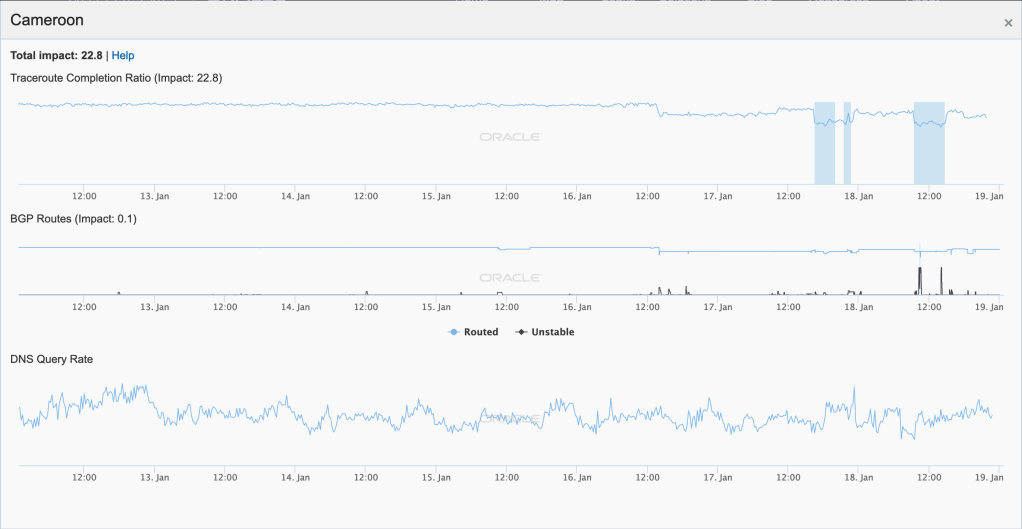
Oracle Internet Intelligence Map Country Statistics graph for Cameroon, January 16 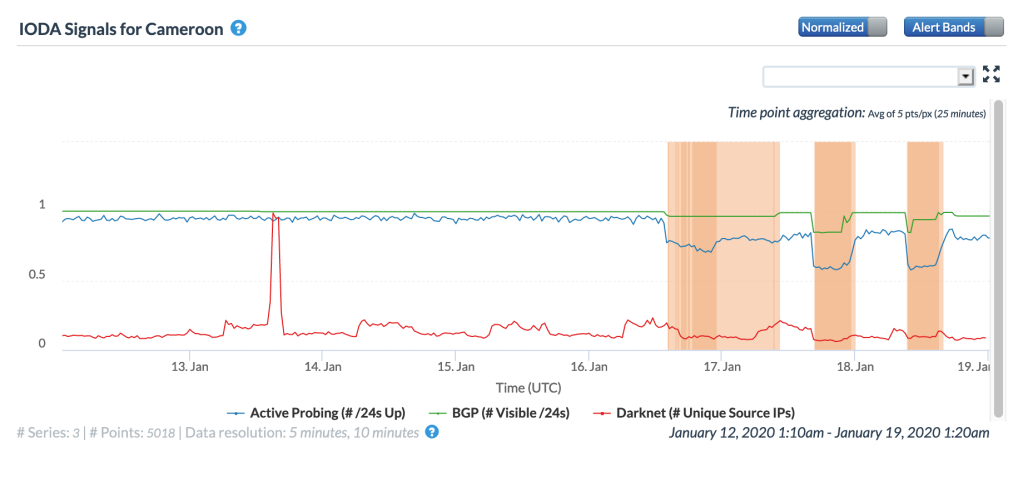
CAIDA IODA graph for Cameroon, January 16 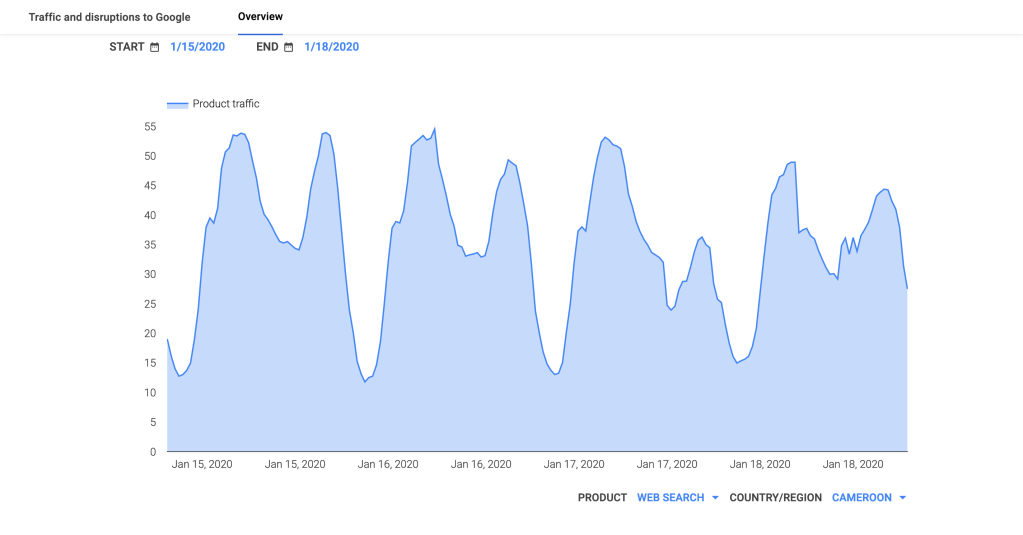
Google Transparency Report traffic graph for Cameroon, January 16

Oracle Internet Intelligence Map Country Statistics graph for Congo, January 16 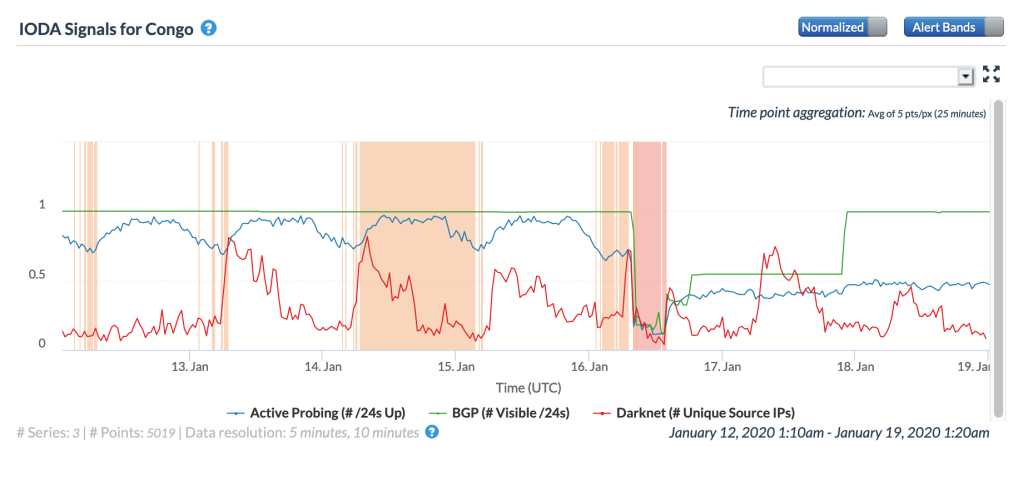
CAIDA IODA graph for Congo, January 16 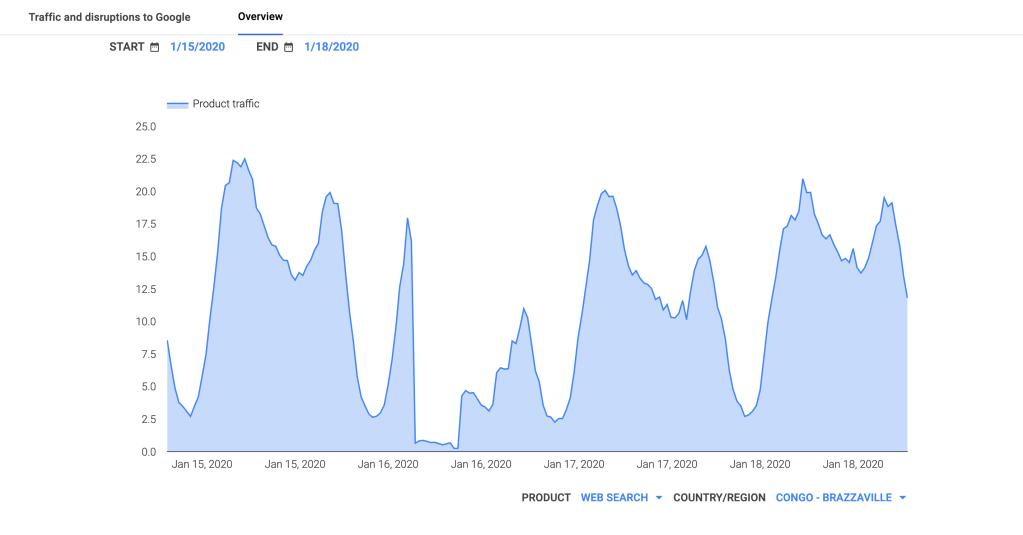
Google Transparency Report traffic graph for Congo, January 16
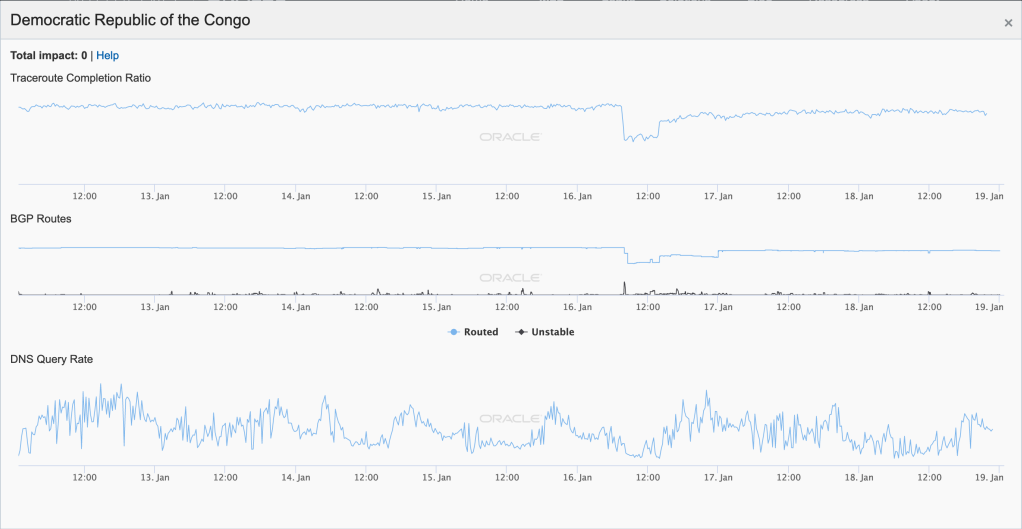
Oracle Internet Intelligence Map Country Statistics graph for Democratic Republic of the Congo, January 16 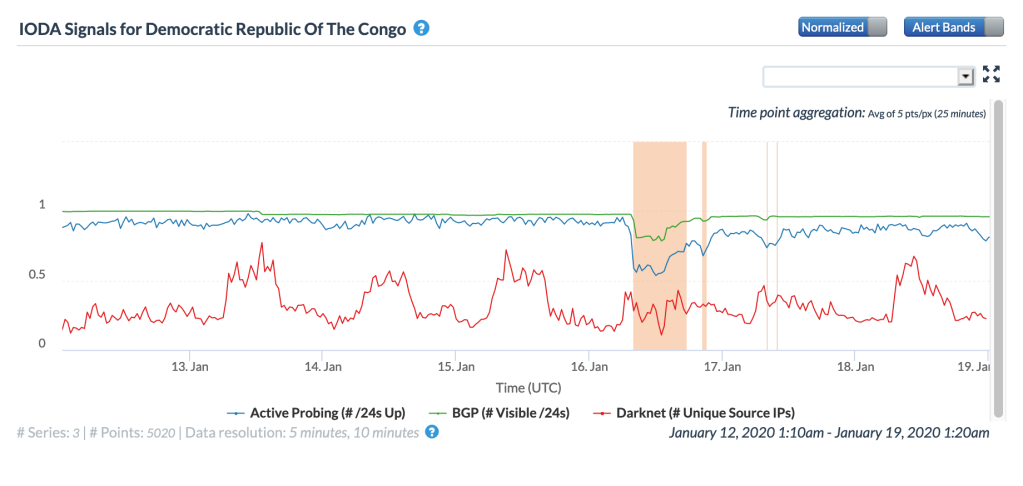
CAIDA IODA graph for Democratic Republic of the Congo, January 16 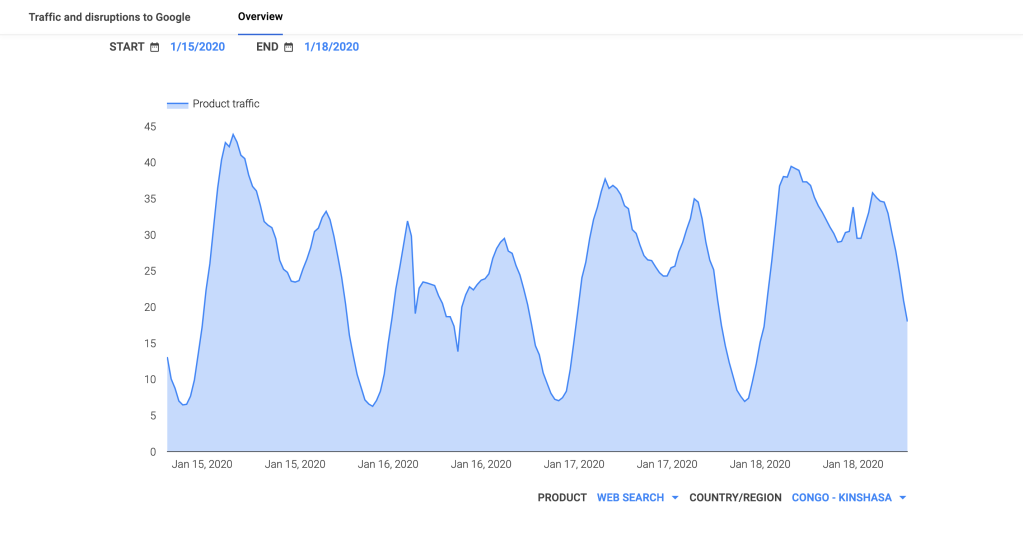
Google Transparency Report traffic graph for Democratic Republic of the Congo, January 16
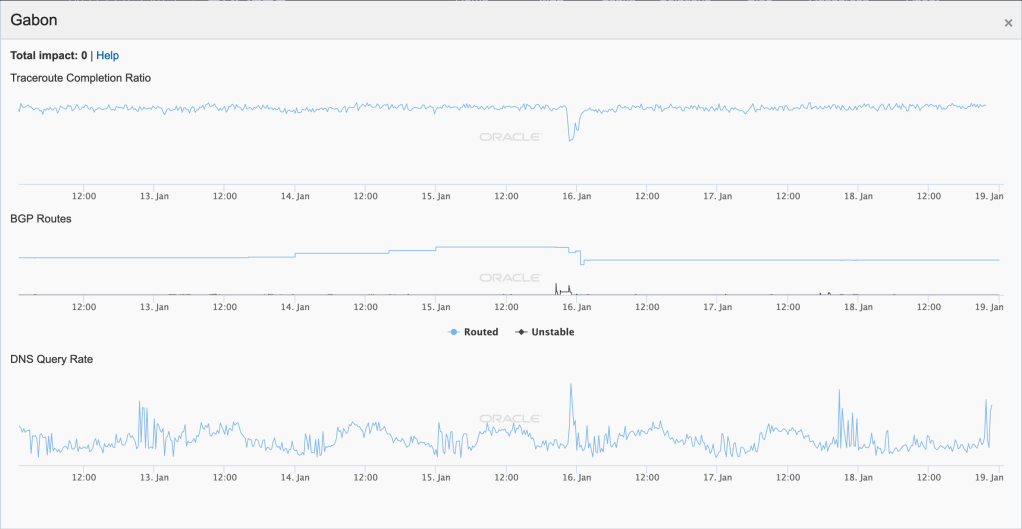
Oracle Internet Intelligence Map Country Statistics graph for Gabon, January 16 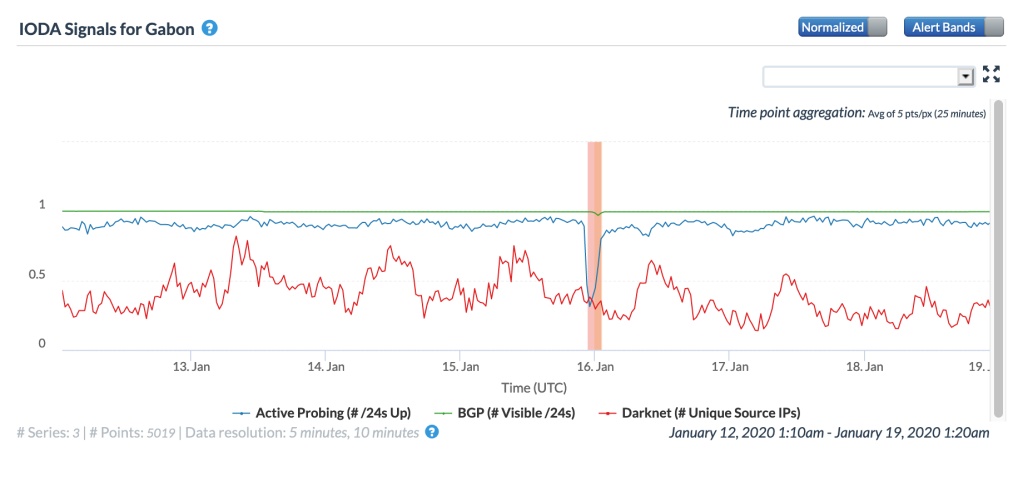
CAIDA IODA graph for Gabon, January 16 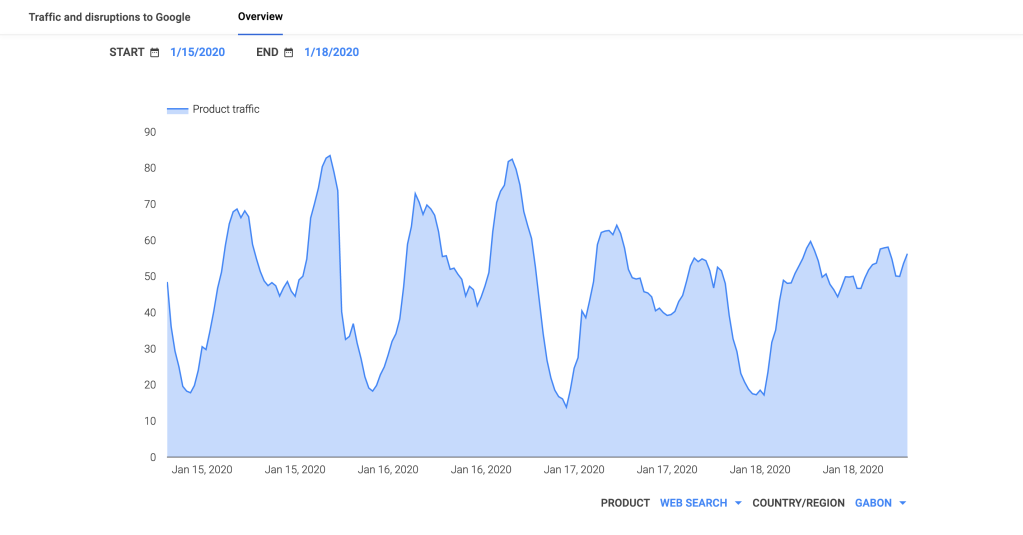
Google Transparency Report traffic graph for Gabon, January 16
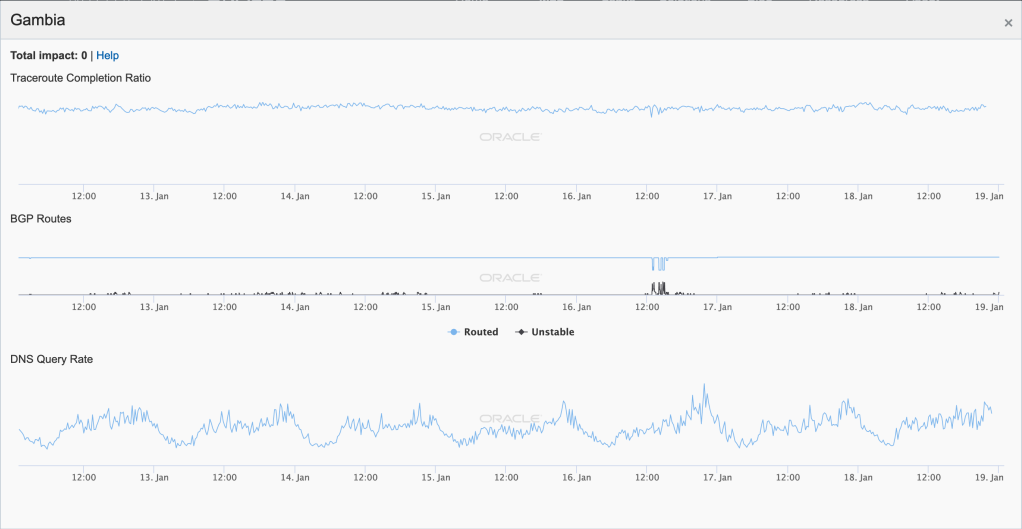
Oracle Internet Intelligence Map Country Statistics graph for the Gambia, January 16 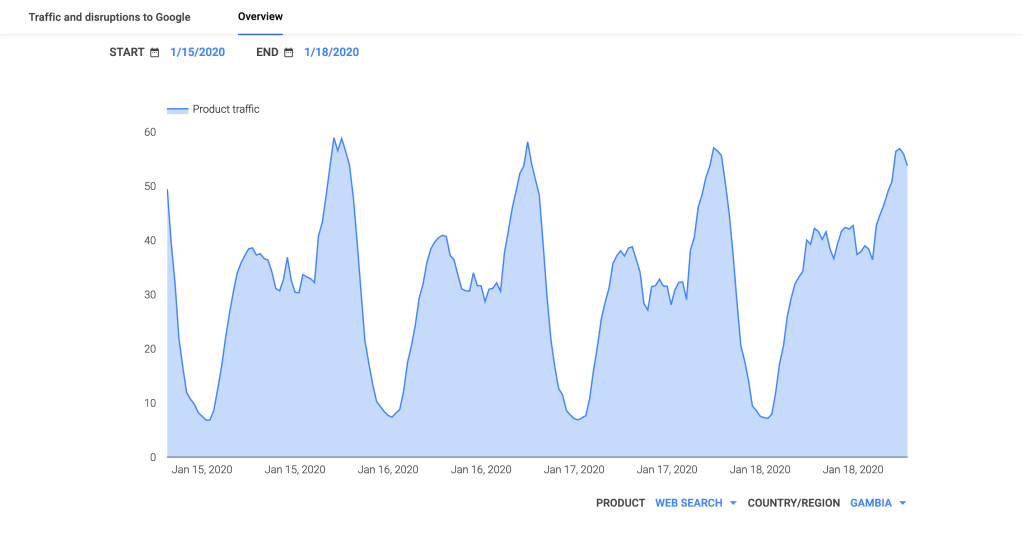
CAIDA IODA graph for the Gambia, January 16 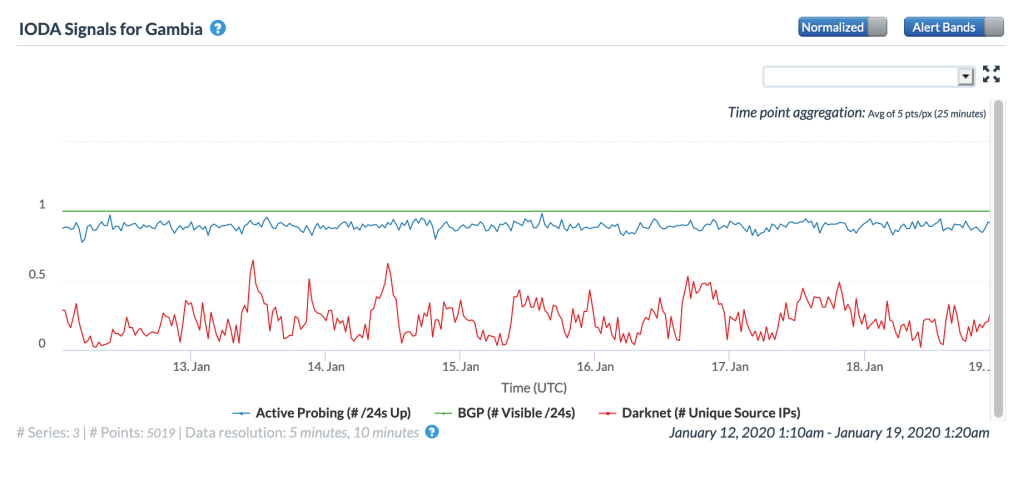
Google Transparency Report traffic graph for the Gambia, January 16
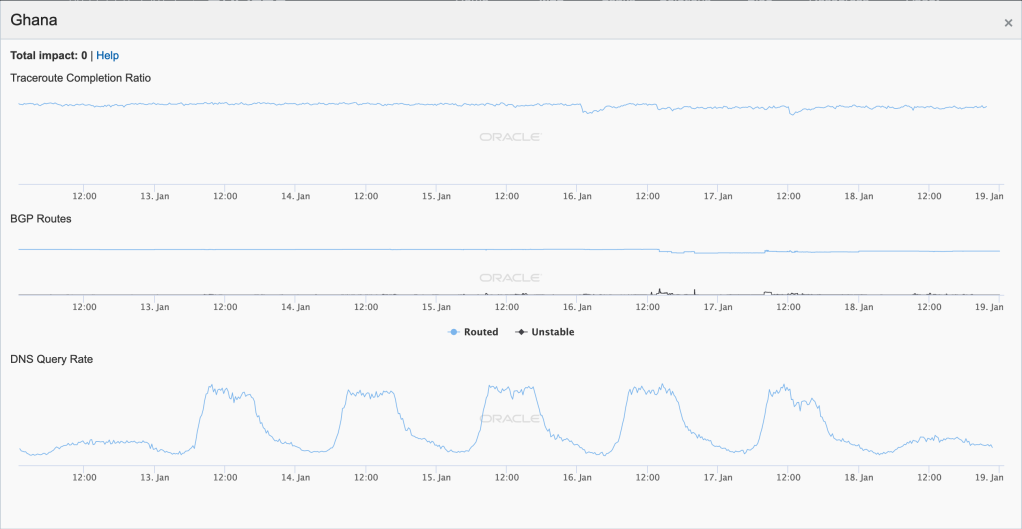
Oracle Internet Intelligence Map Country Statistics graph for Ghana, January 16 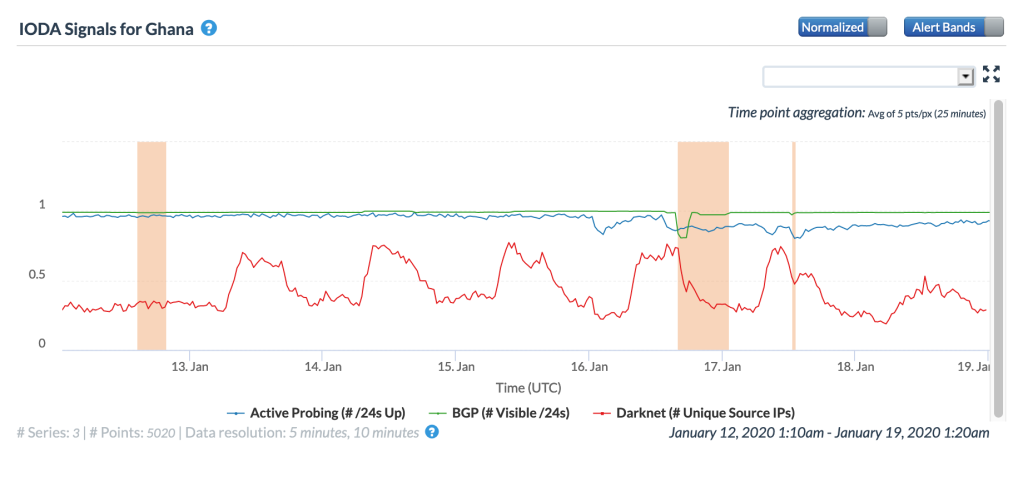
CAIDA IODA graph for Ghana, January 16 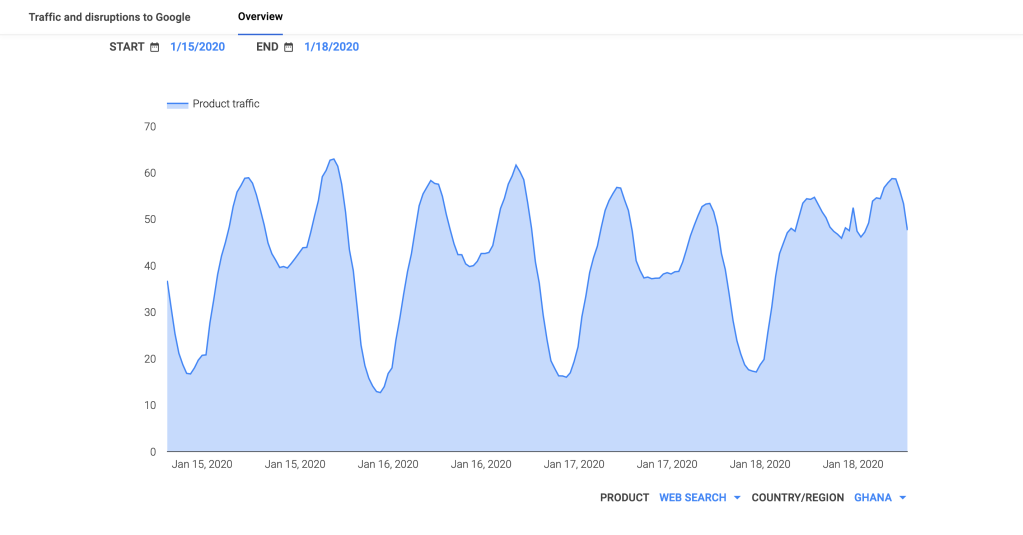
Google Transparency Report traffic graph for Ghana, January 16
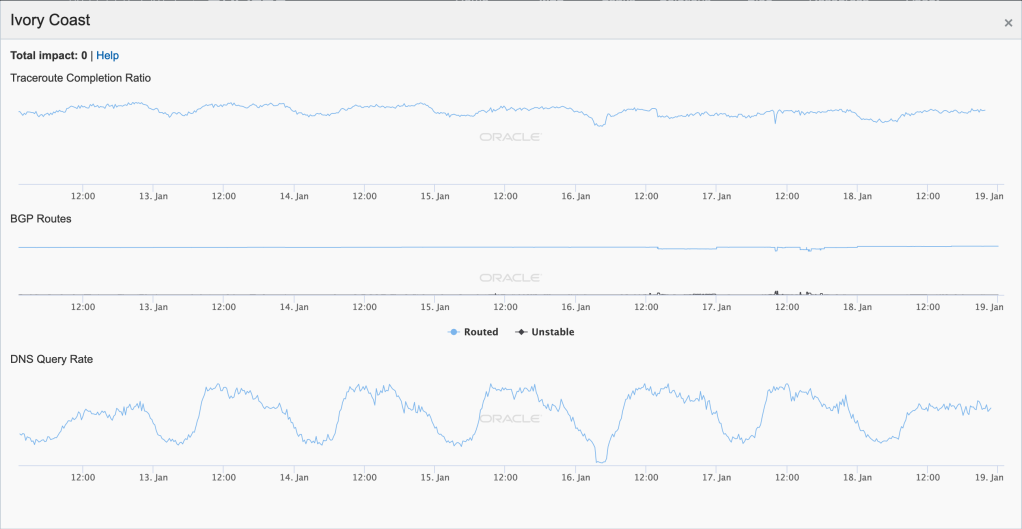
Oracle Internet Intelligence Map Country Statistics graph for Ivory Coast, January 16 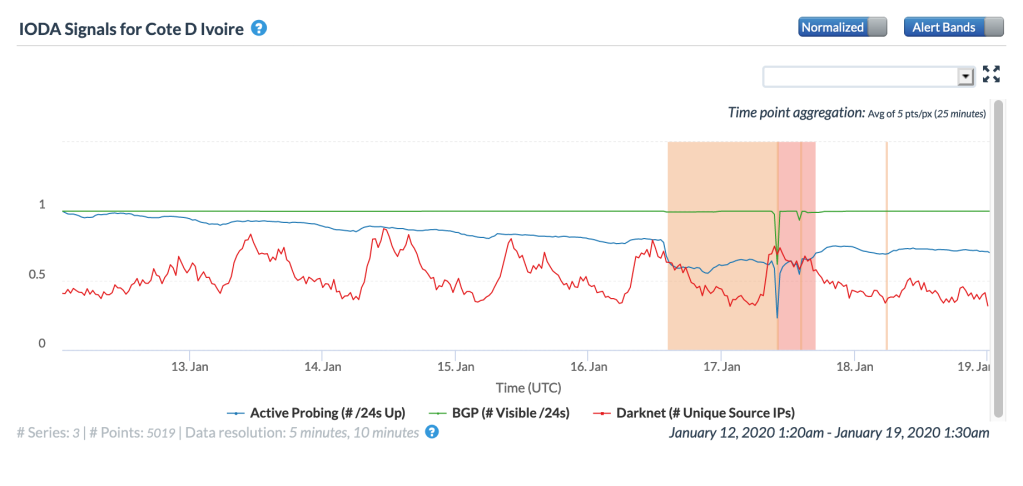
CAIDA IODA graph for Ivory Coast, January 16 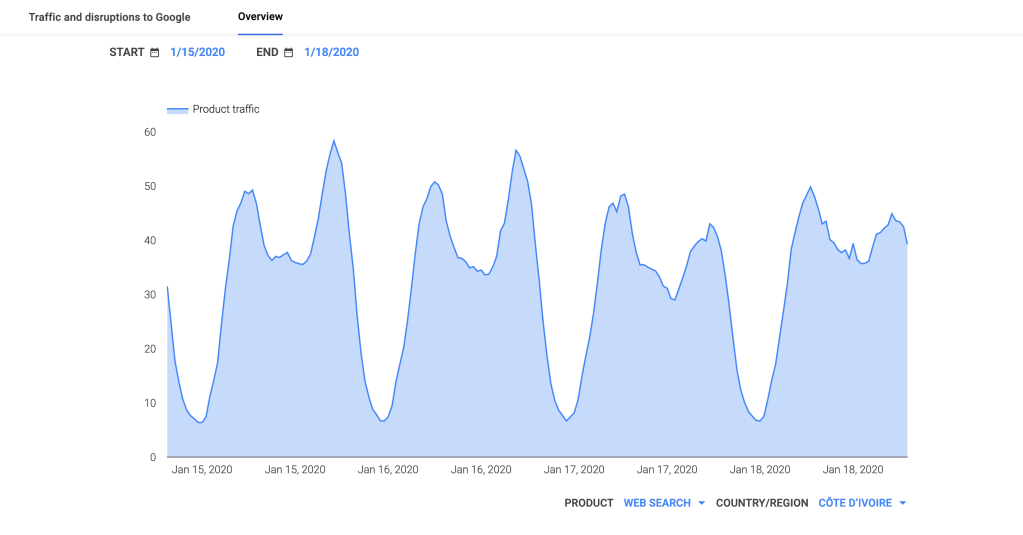
Google Transparency Report traffic graph for Ivory Coast, January 16
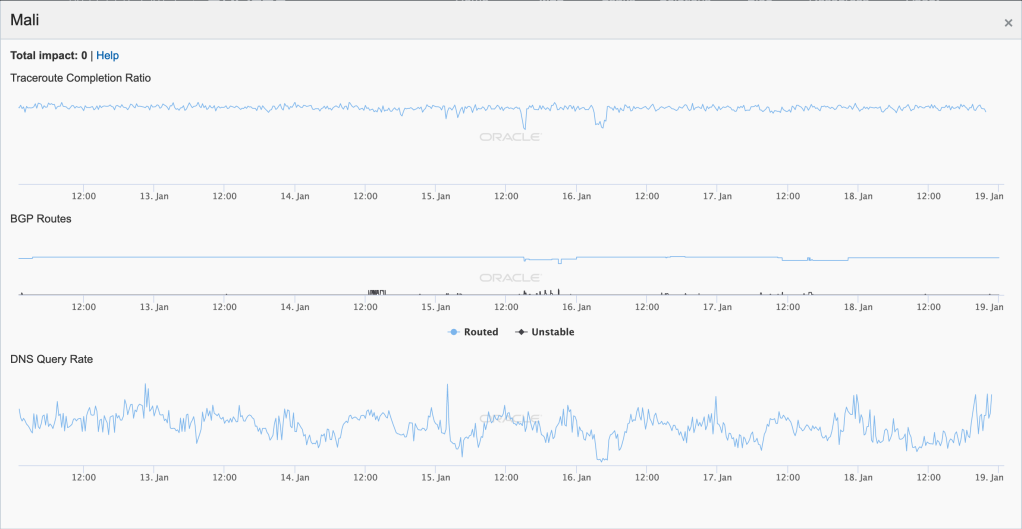
Oracle Internet Intelligence Map Country Statistics graph for Mali, January 16 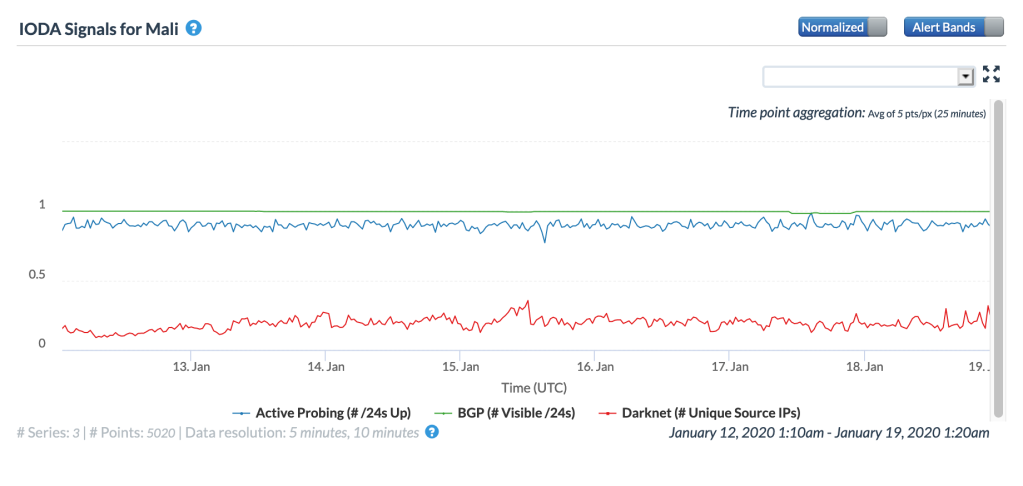
CAIDA IODA graph for Mali, January 16 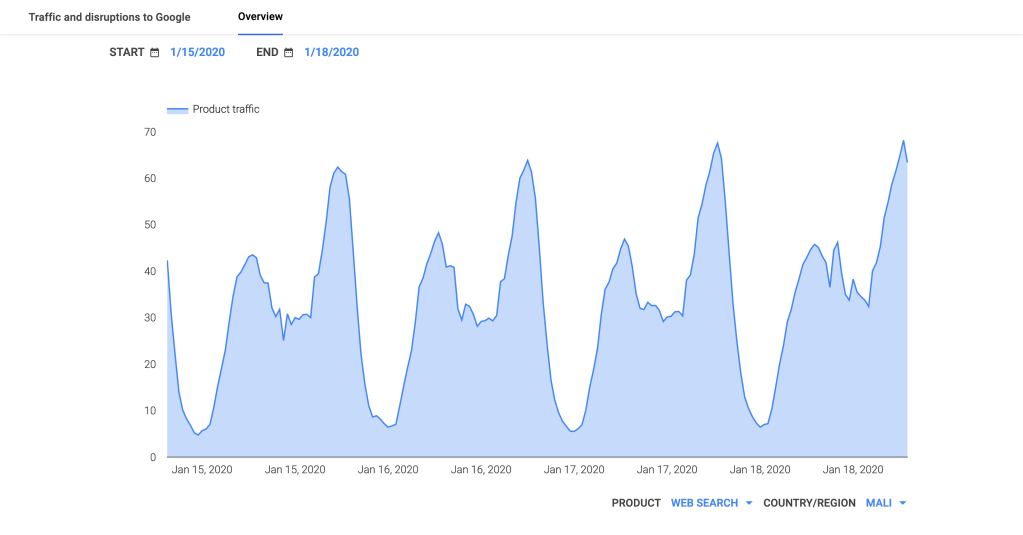
Google Transparency Report traffic graph for Mali, January 16
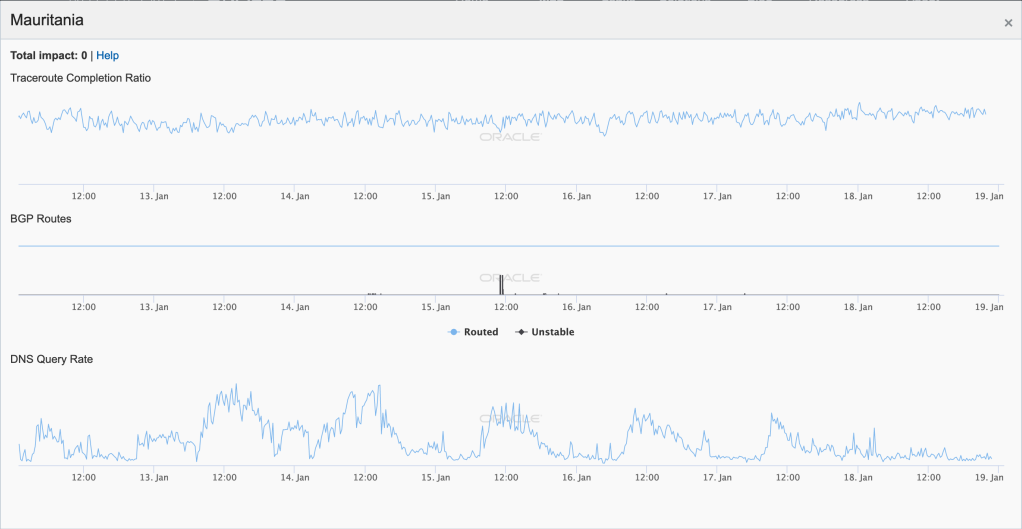
Oracle Internet Intelligence Map Country Statistics graph for Mauritania, January 16 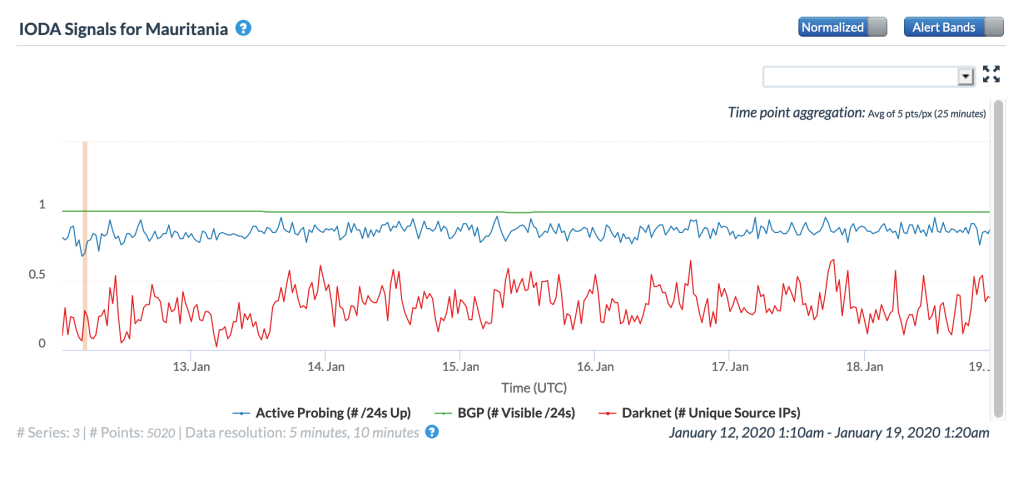
CAIDA IODA graph for Mauritania, January 16 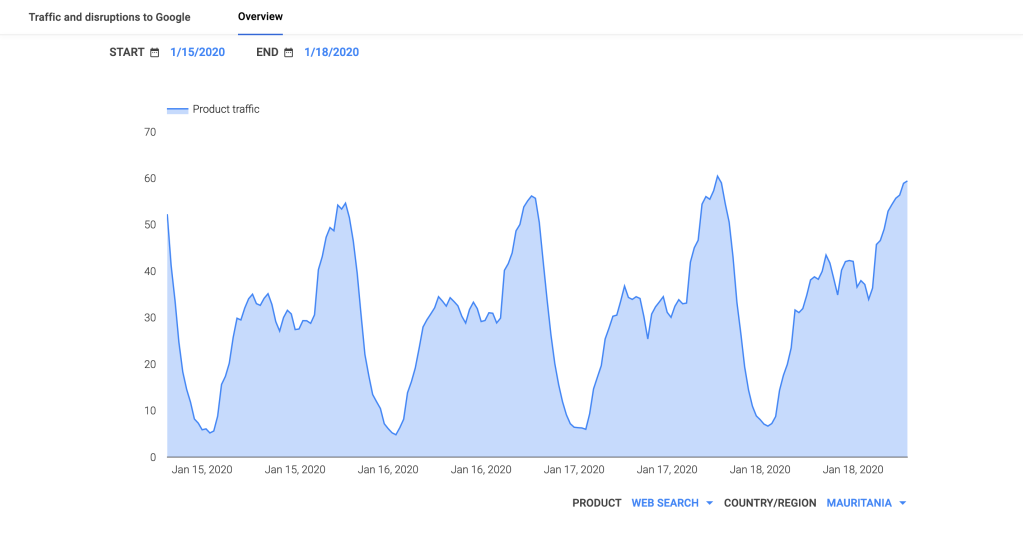
Google Transparency Report traffic graph for Mauritania, January 16
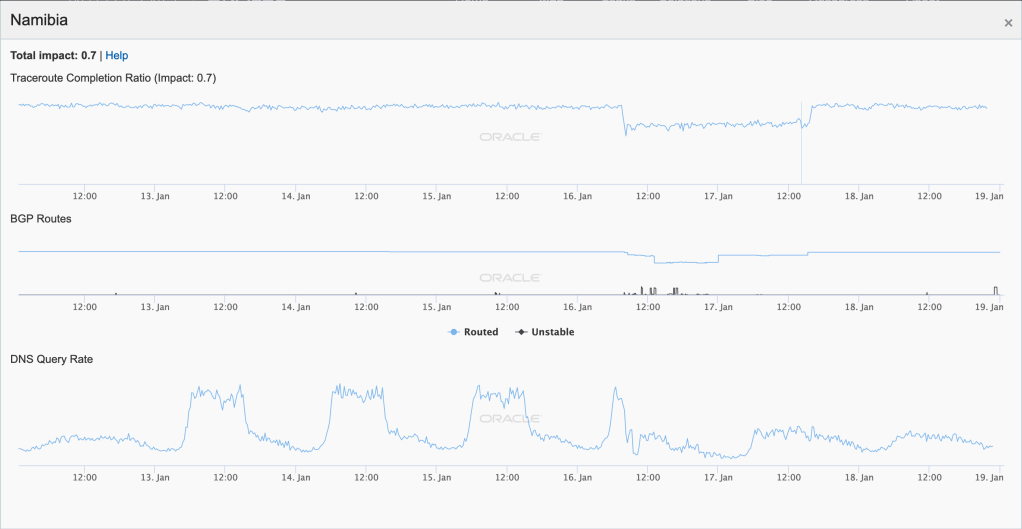
Oracle Internet Intelligence Map Country Statistics graph for Namibia, January 16 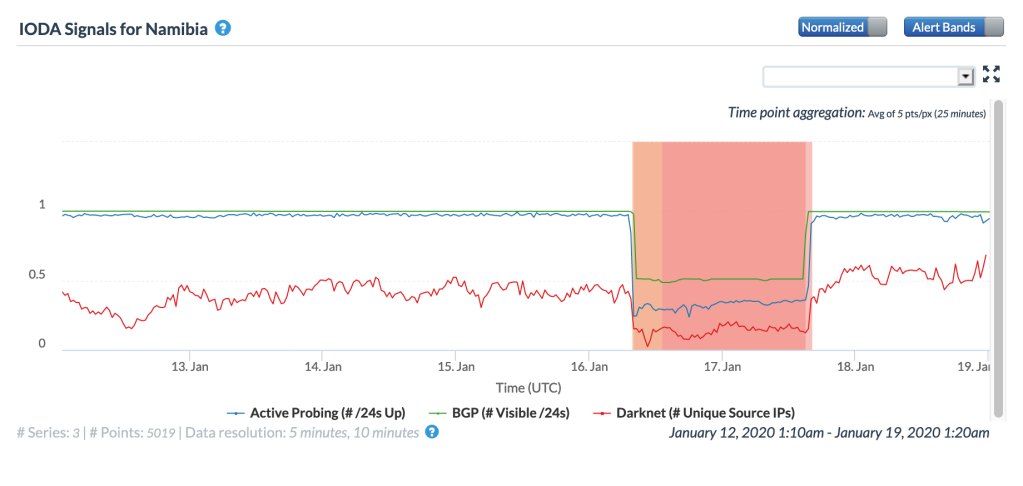
CAIDA IODA graph for Namibia, January 16 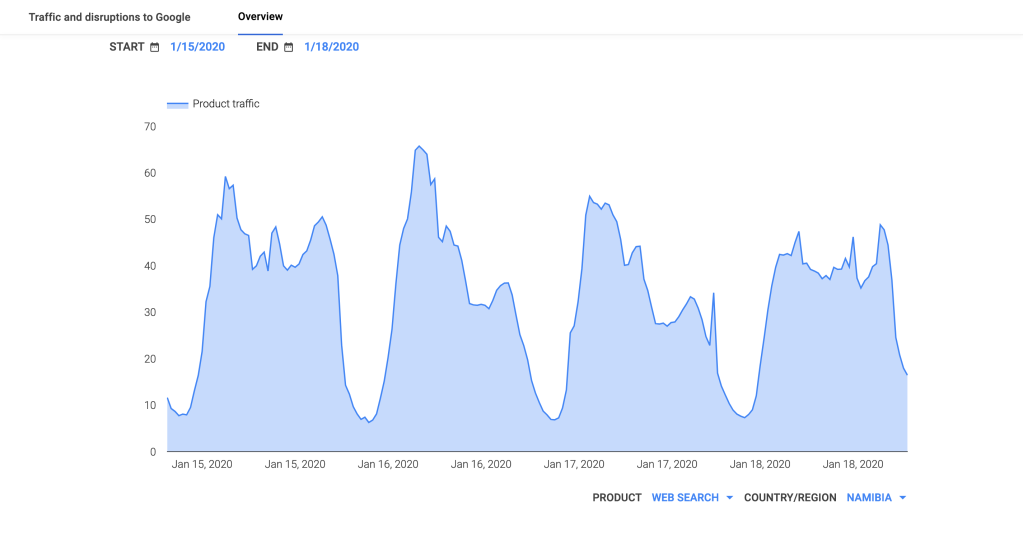
Google Transparency Report traffic graph for Namibia, January 16
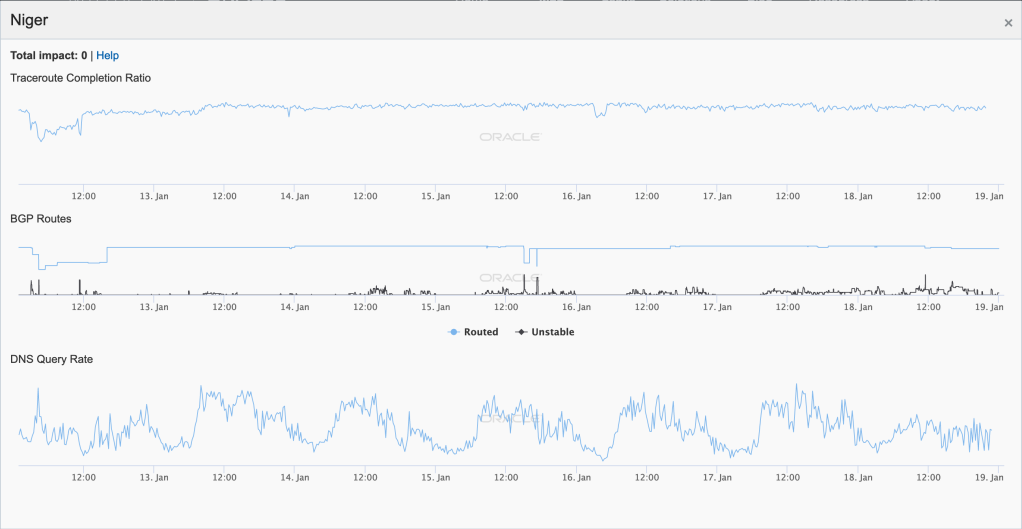
Oracle Internet Intelligence Map Country Statistics graph for Niger, January 16 
CAIDA IODA graph for Niger, January 16 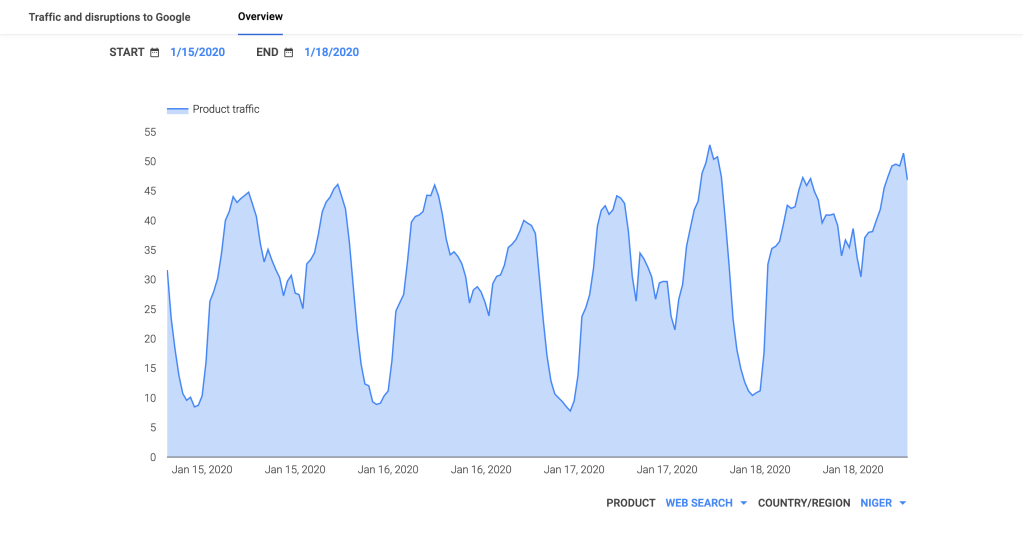
Google Transparency Report traffic graph for Niger, January 16
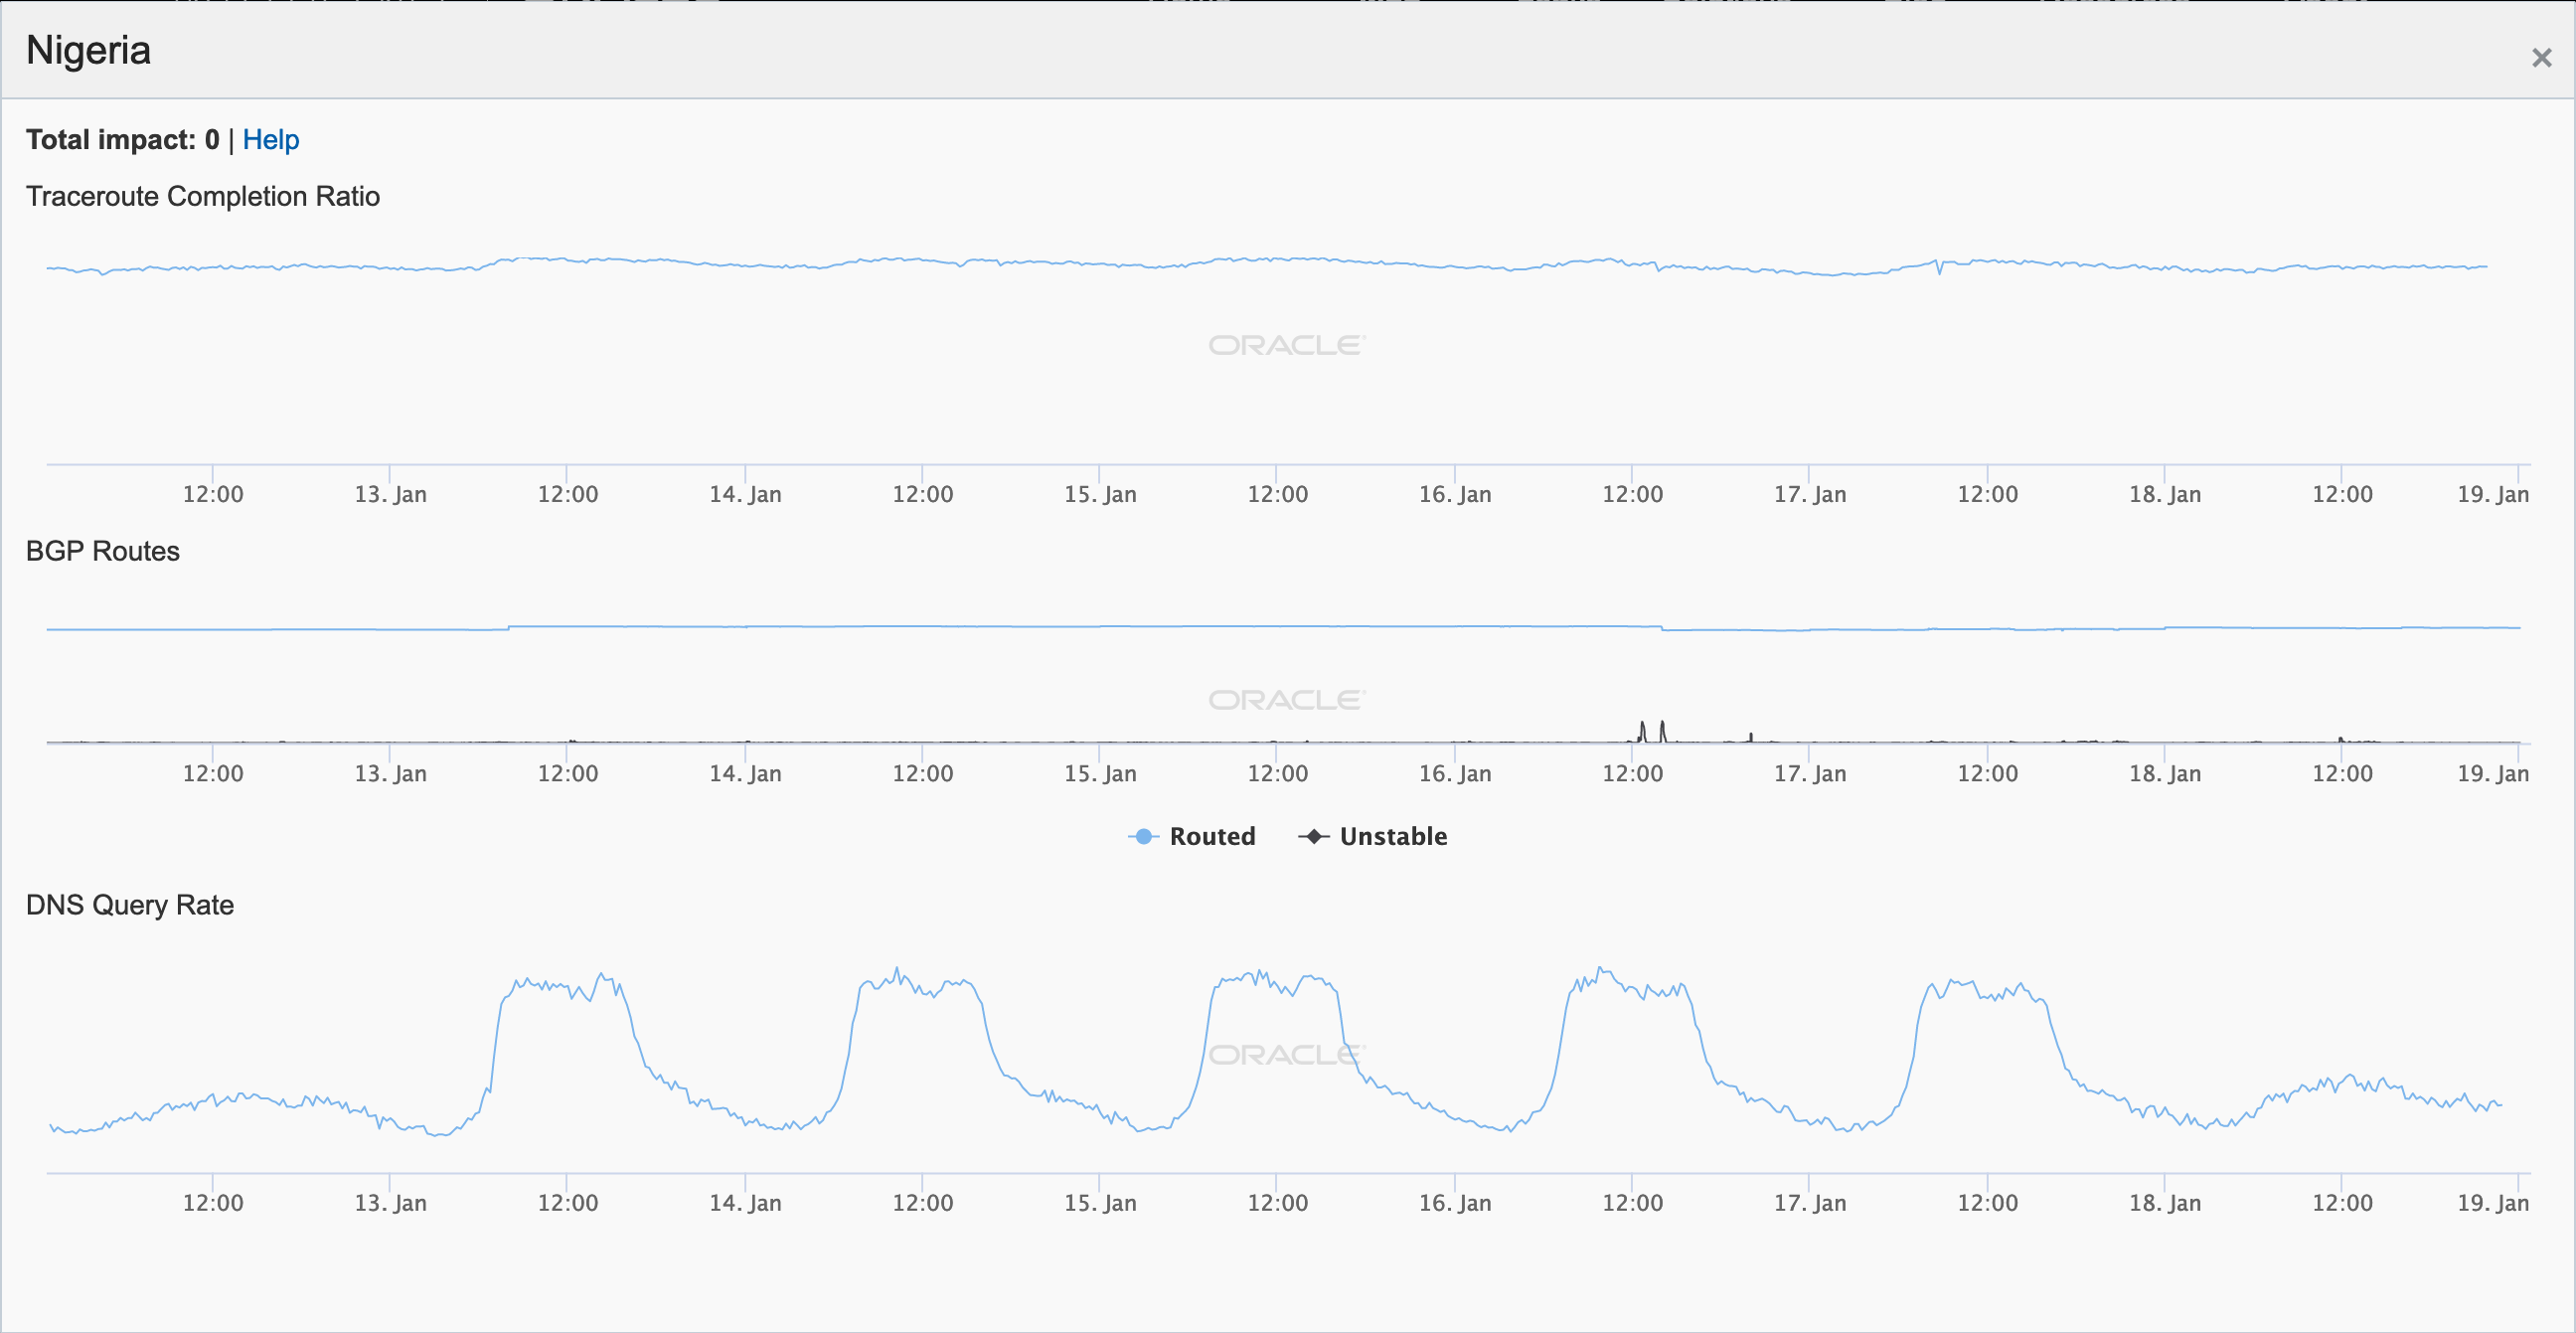
Oracle Internet Intelligence Map Country Statistics graph for Nigeria, January 16 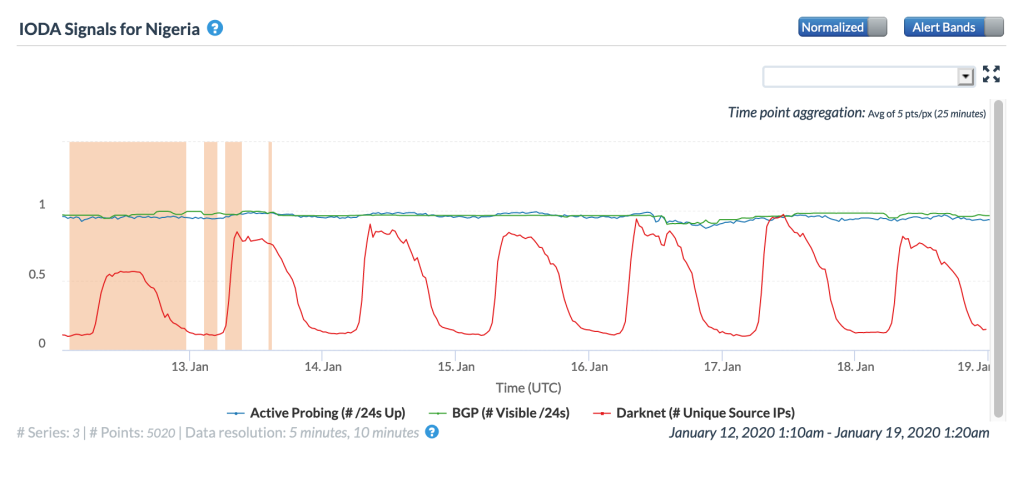
CAIDA IODA graph for Nigeria, January 16 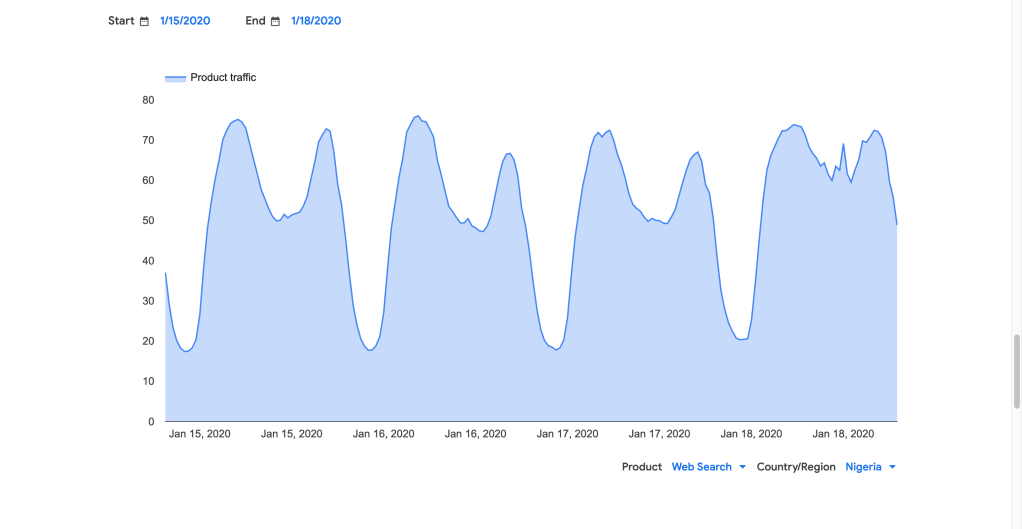
Google Transparency Report traffic graph for Nigeria, January 16
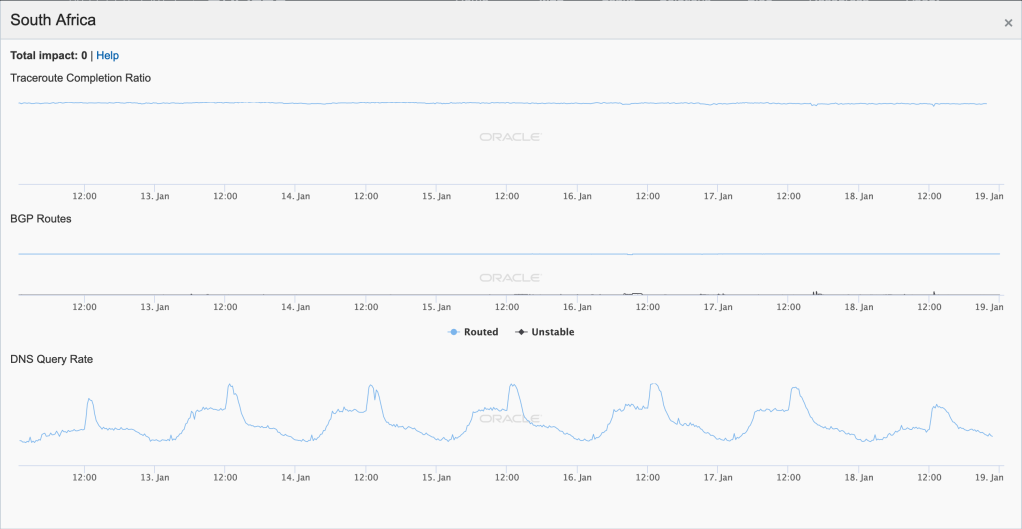
Oracle Internet Intelligence Map Country Statistics graph for South Africa, January 16 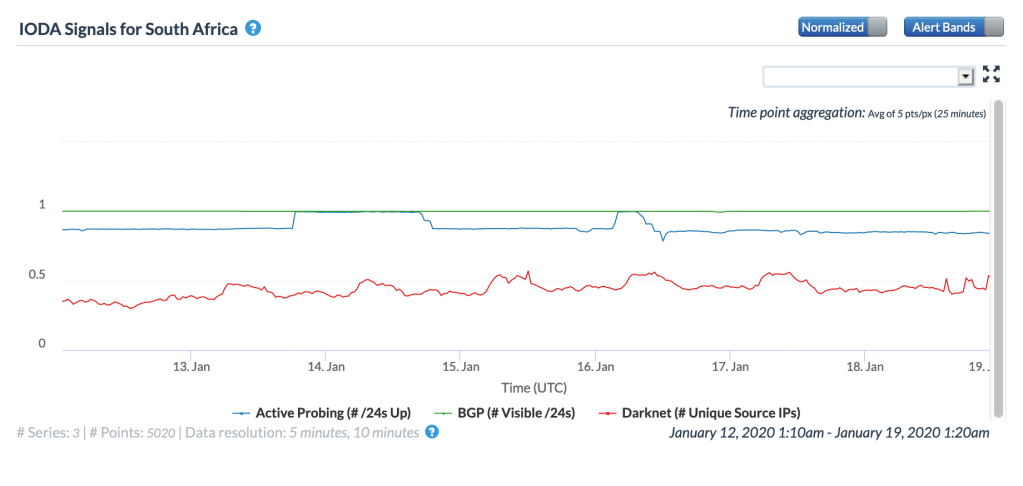
CAIDA IODA graph for South Africa, January 16 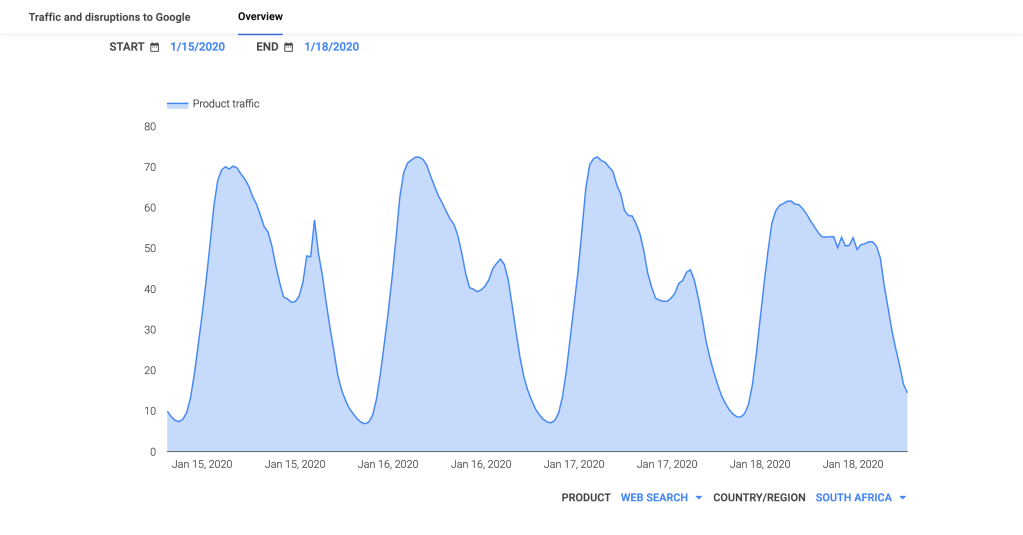
Google Transparency Report traffic graph for South Africa, January 16
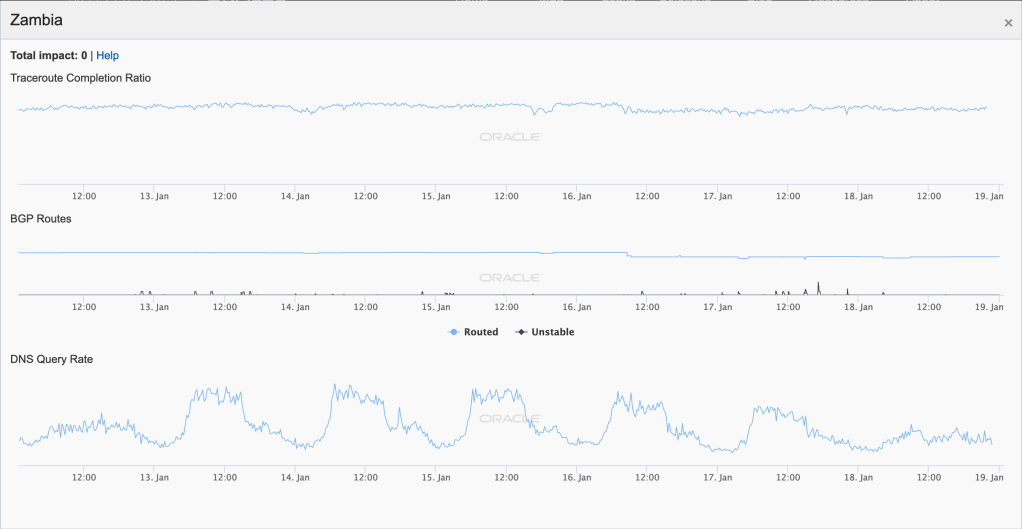
Oracle Internet Intelligence Map Country Statistics graph for Zambia, January 16 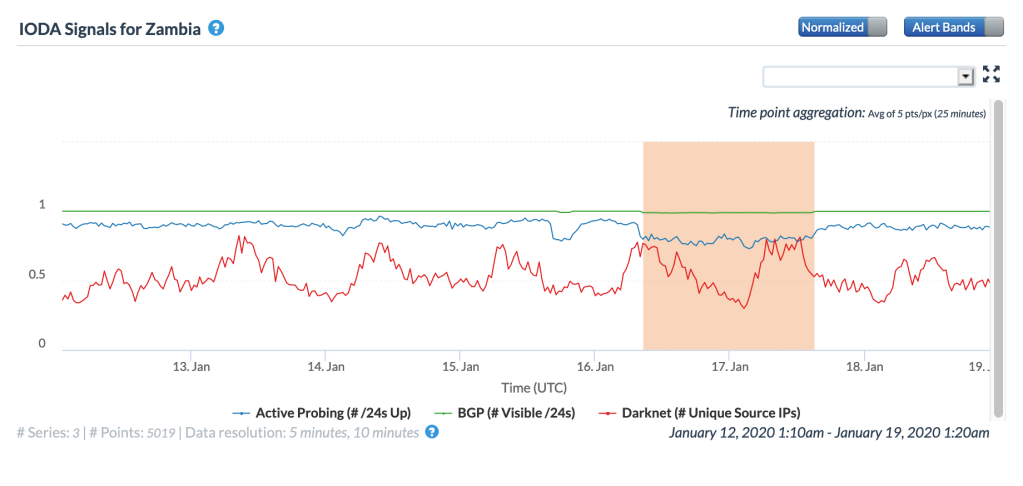
CAIDA IODA graph for Zambia, January 16 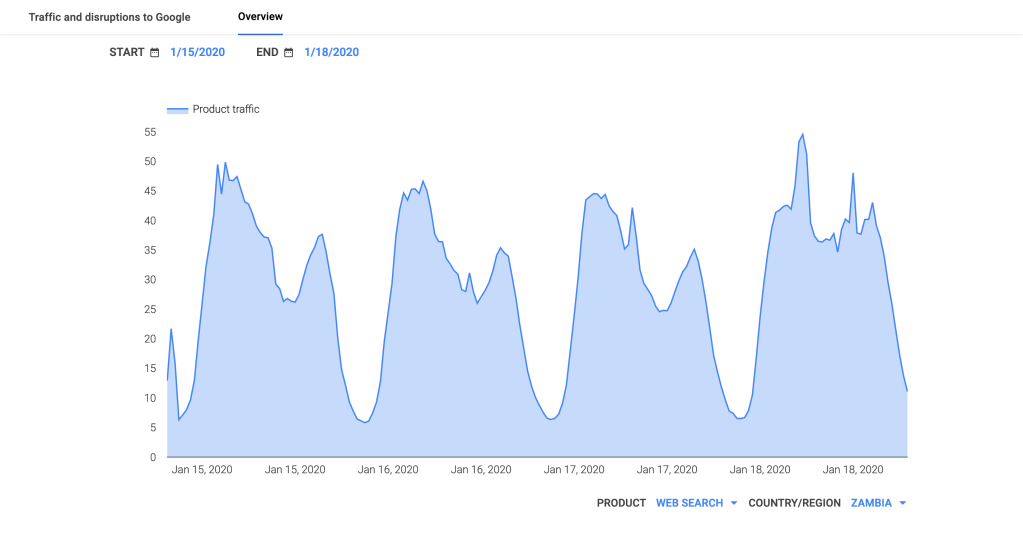
Google Transparency Report traffic graph for Zambia, January 16
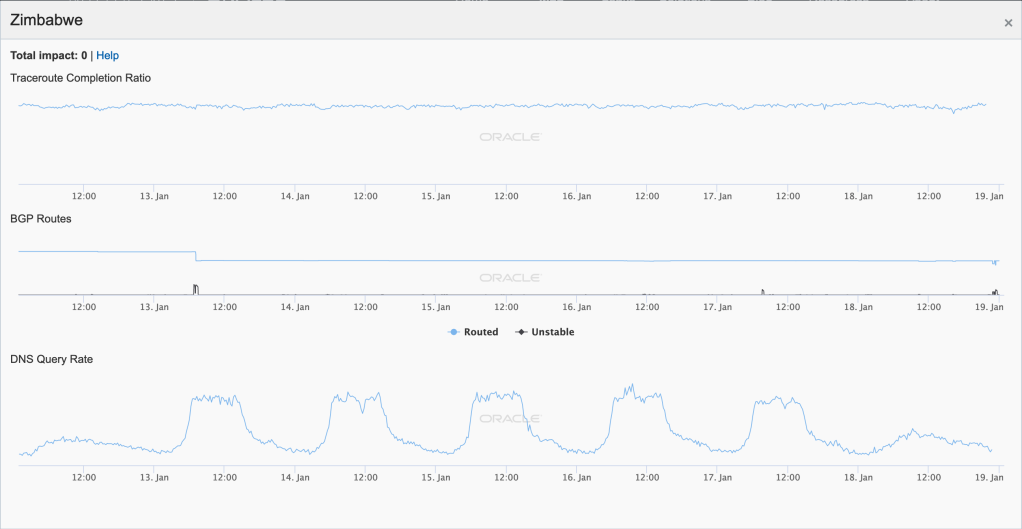
Oracle Internet Intelligence Map Country Statistics graph for Zimbabwe, January 16 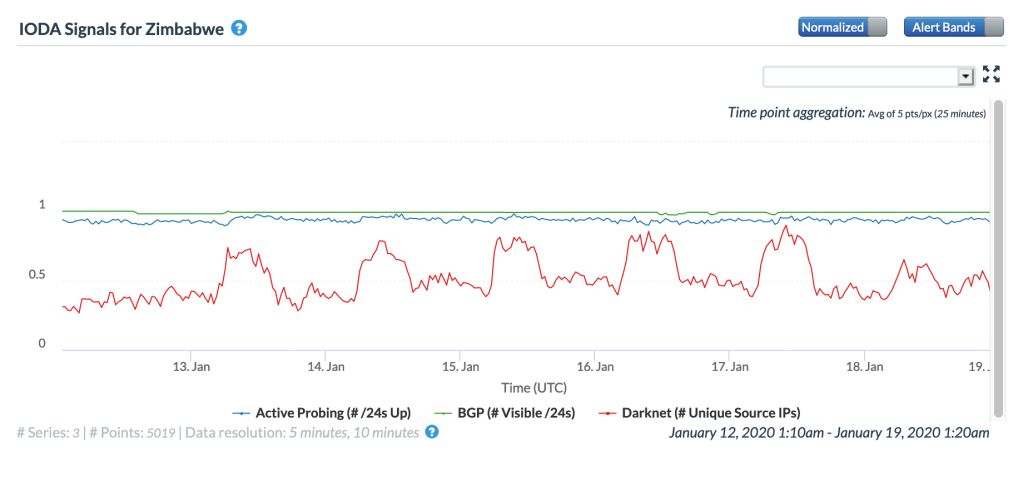
CAIDA IODA graph for Zimbabwe, January 16 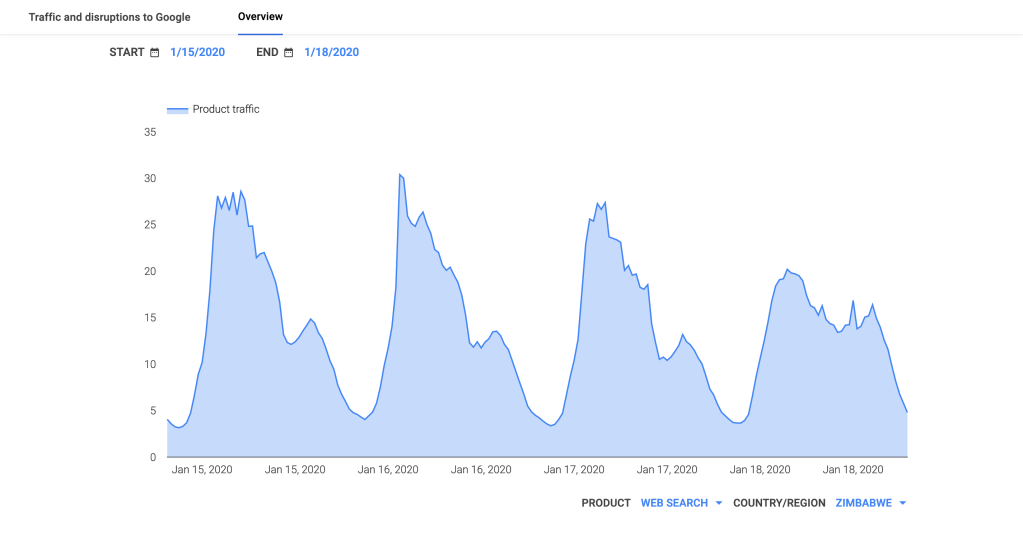
Google Transparency Report traffic graph for Zimbabwe, January 16
In reviewing the figures above, the disruption caused by the cable breaks was most evident in the graphs for Congo, the Democratic Republic of Congo, and Namibia, with lesser impact evident in Angola, Cameroon, Gabon, Ghana, and Ivory Coast.
As expected, the Internet disruption was heavily covered on news Web sites in the impacted countries, and affected telecom providers including Telecom Namibia, MTN Namibia, CAMTEL, Cool Ideas, and RSAWeb provided status updates to subscribers via social media or their corporate Web sites.
The WACS cable was reportedly damaged by “heavy sediment”, and connectivity was fully restored on both the WACS and SAT-3/WASC cable systems by February 19, according to a published report.
On January 23, Togo Telecom posted the Tweet below alerting customers that an Internet disruption that started the day before was due to a problem with the WACS cable.
Togocom vous présente ses excuses pour ce désagrément indépendant de sa volonté et vous remercie pour votre patience et votre confiance. pic.twitter.com/sfwOzNN7j8
— TOGO TELECOM (@TOGOTELECOM1) January 23, 2020
Dear clients,
Since Wednesday January 22, 2020. Togo, like all the sub-region, whose internet connection depends on the West African submarine cable (WACS- West African Cable System) faces a partial or total absence of internet service This follows to a double section on the submarine cable segments as well as on the terrestrial backup segment.
The Togocom teams as well as the international teams of the cable operator are already hard at work for the rapid resolution of this incident. All the means are implemented by all the stakeholders for an effective and rapid resolution of the problem. ,
Togocom will keep you informed in real time of the progress of the work to restore complete internet service.
Togocom apologizes for this inconvenience beyond its control and thanks you for your patience and your confidence.
(via Google Translate)
The figures below illustrate the impact of this problem on Internet connectivity at a country level in Togo, as well as to connectivity to Togo Telecom.

Oracle Internet Intelligence Map Country Statistics graph for Togo, January 22-23 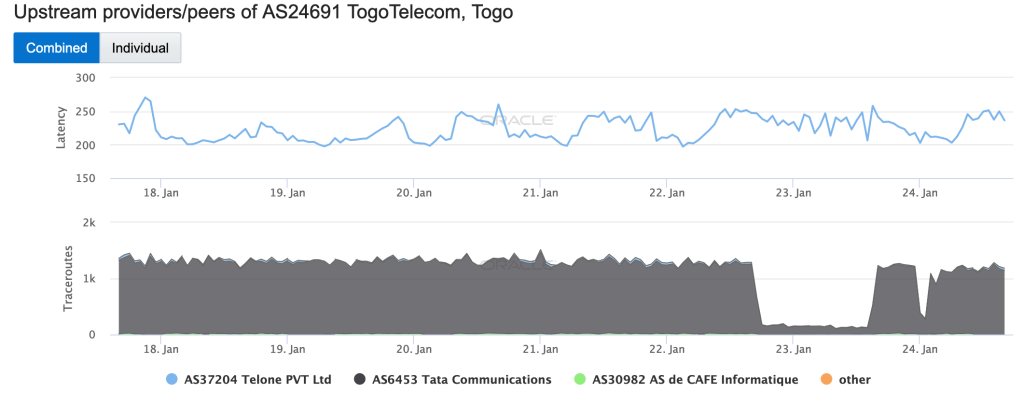
Oracle Internet Intelligence Map Traffic Shifts graph for AS24691 (Togo Telecom), January 22-23 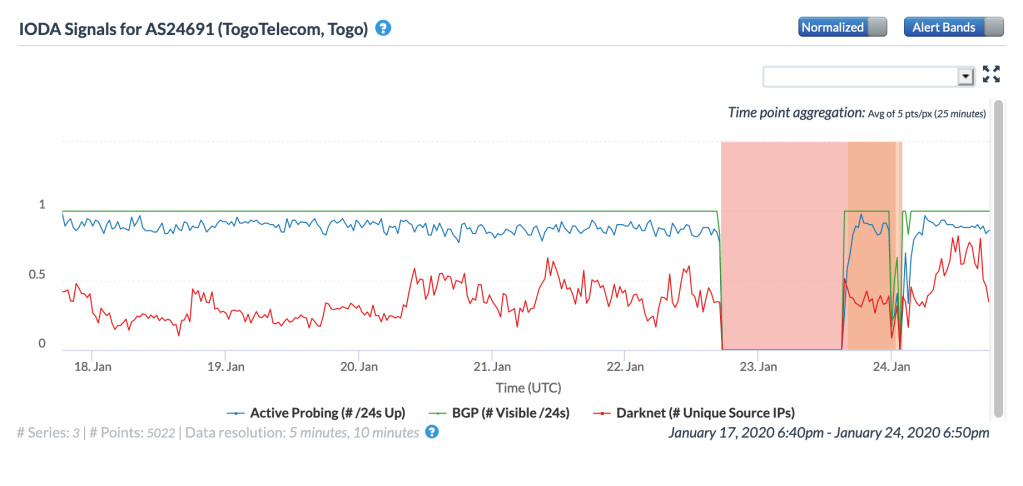
CAIDA IODA graph for AS24691 (Togo Telecom), January 22-23
There was some distrust of Togo Telecom’s claim of a technical problem, given Togo’s history of Internet shutdowns and the fact that this issue occurred exactly a month before an election. However, the Oracle and CAIDA figures below show that an Internet disruption of extremely similar scope and duration was observed at the same time in Cape Verde, with a disruption in Cameroon also starting at the same time, though it was less significant than the ones in Togo and Cape Verde. Because Cape Verde and Cameroon are also connected to the WACS submarine cable, this would seem to support the claim that there was indeed a problem with the cable.
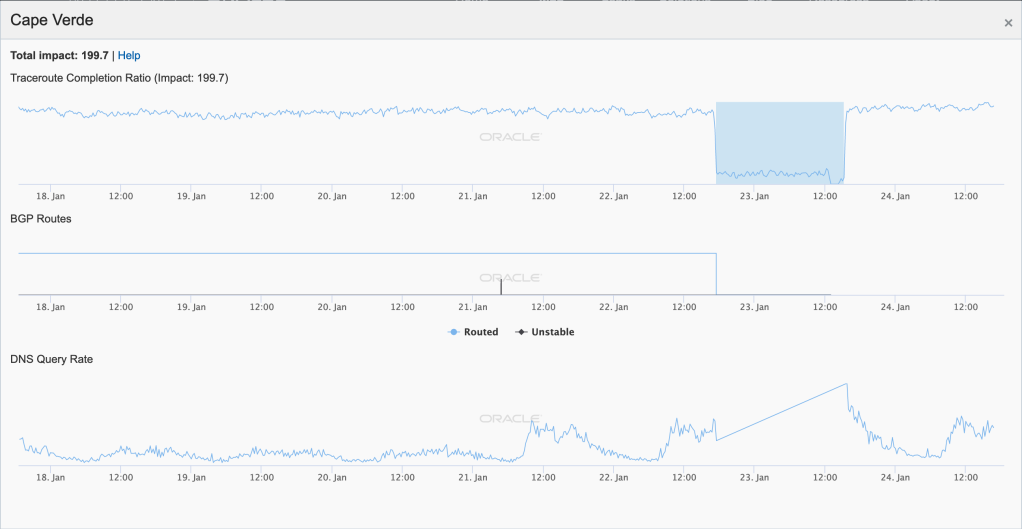
Oracle Internet Intelligence Map Country Statistics graph for Cape Verde, January 22-23 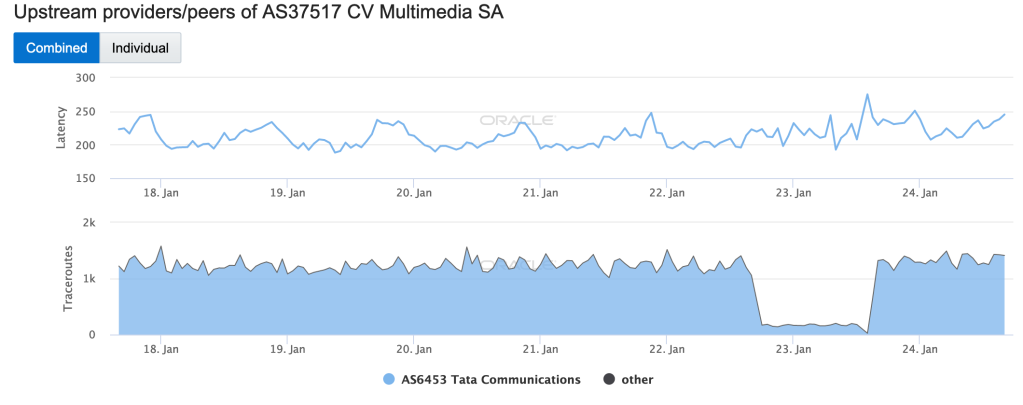
Oracle Internet Intelligence Map Traffic Shifts graph for AS37517 (Cabo Verde Telecom), January 22-23 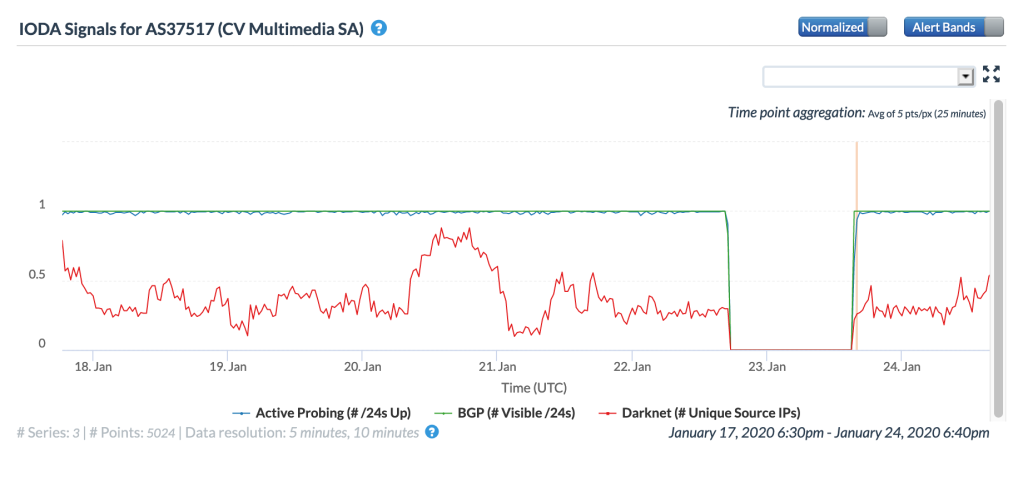
CAIDA IODA graph for AS37517 (Cabo Verde Telecom), January 22-23
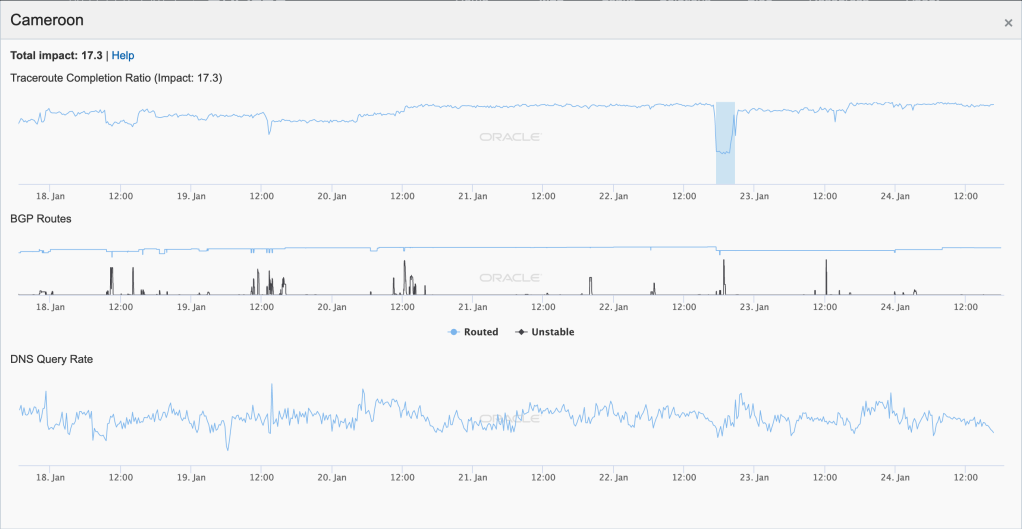
Oracle Internet Intelligence Map Country Statistics graph for Cameroon, January 22-23 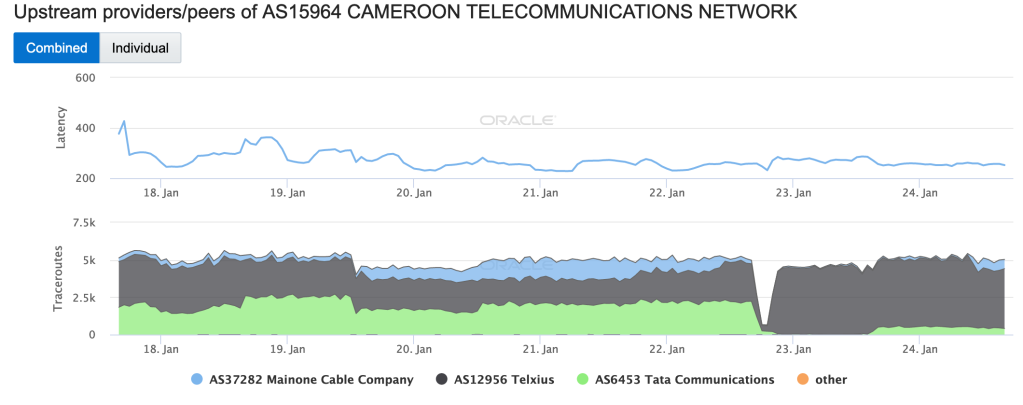
Oracle Internet Intelligence Map Traffic Shifts graph for AS15964 (CAMTEL), January 22-23 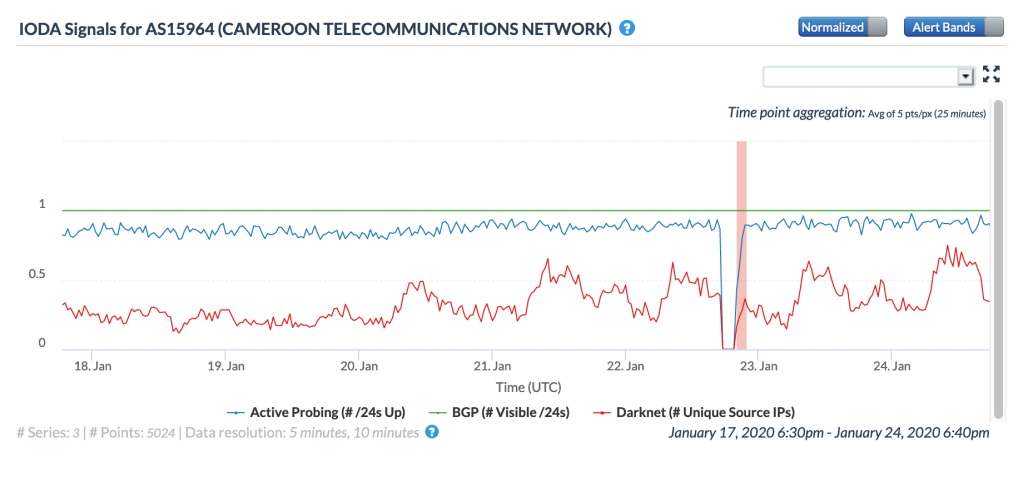
CAIDA IODA graph for AS15964 (CAMTEL), January 22-23
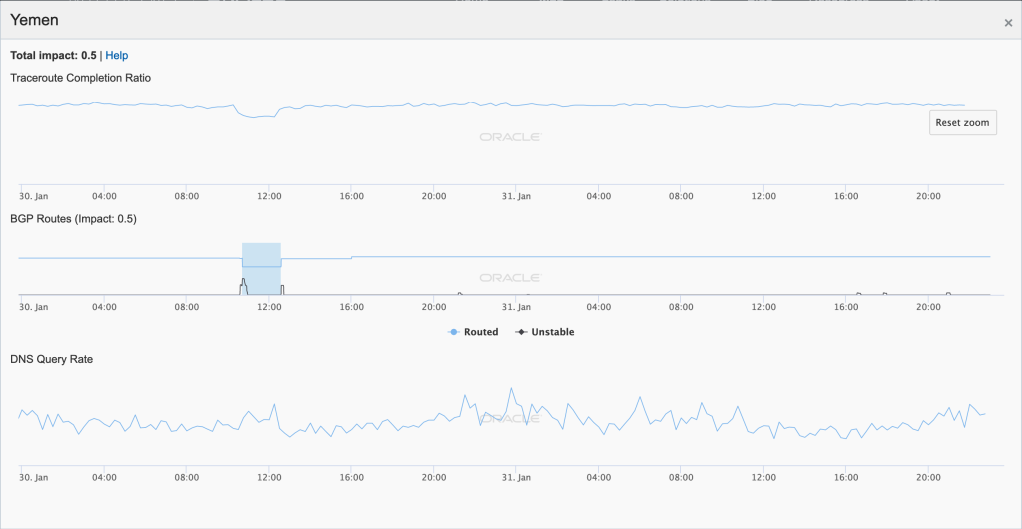
Closing out the month, a brief Internet disruption was observed in Yemen. lasting for several hours during the late morning (GMT) of January 30. The figures below show the impact at a country level, as well as at a network level for AS30873 (YemenNet). Both the Oracle Internet Intelligence and CAIDA IODA graphs show a brief drop in the BGP metric. However, it is interesting to note that while the Oracle graphs show a corresponding drop for active probing, that metric does not decline in the CAIDA measurements. Oddly, it actually appears to improve during the period of disruption, which is unexpected.
Oracle Internet Intelligence Map Country Statistics graph for Yemen, January 30 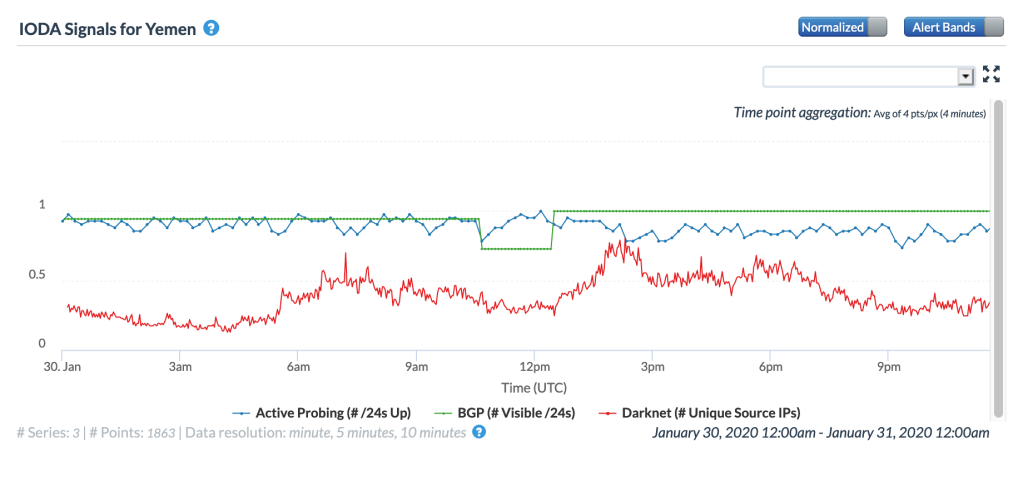
CAIDA IODA graph for Yemen, January 30
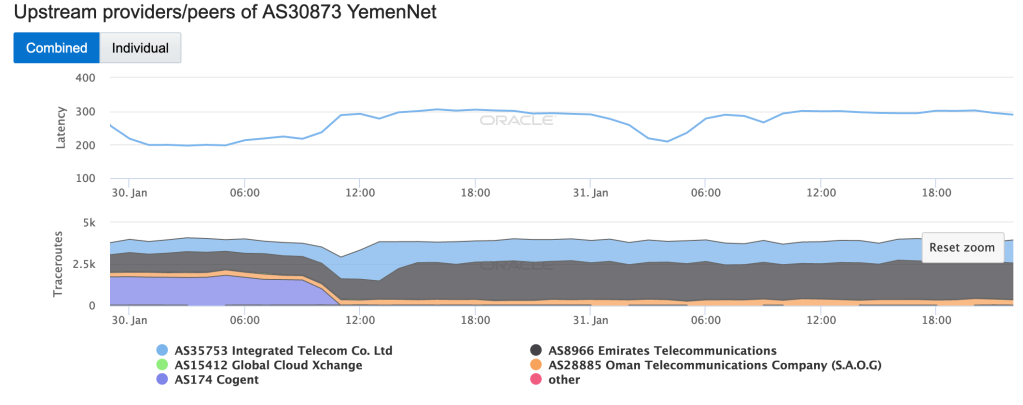
Oracle Internet Intelligence Map Traffic Shifts graph for AS30873 (YemenNet), January 30 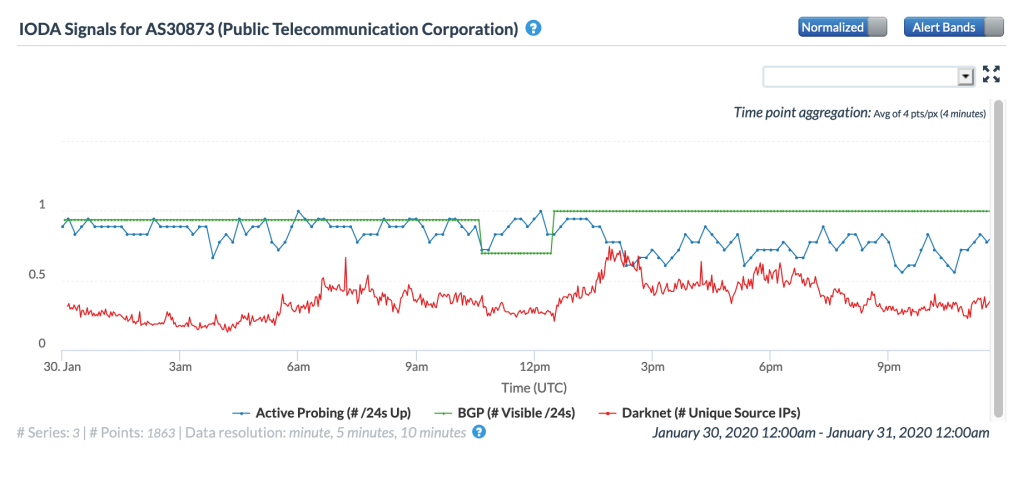
CAIDA IODA graph for AS30873 (YemenNet), January 30
According to a published report, the disruption was reportedly caused by a Saudi-led coalition mercenary militia in Aden province storming the international link station and cutting off access to the international Aden-Djibouti cable.
Conclusion
#Kashmir has lost some Rs 1.78 lakh crore ($25 billion) in economic output in the five months since August 2019. This is 11% of the erstwhile state’s nominal gross state domestic product (GSDP) of Rs 1.59 lakh crore for 2018-19. @qzindia https://t.co/75kHirozkl
— InternetShutdowns.in (@NetShutdowns) February 21, 2020
The Internet disruptions covered in this month’s report were all generally short-lived, likely resulting in limited economic impact. However, the Internet shutdown in the Indian states of Jammu and Kashmir started in August 2019, and had an estimated impact of USD $25 billion in the five months after in began. However, there are positive signs, as in January, the Indian Supreme court said that an indefinite shutdown of the Internet in Kashmir was illegal. Limited Internet service was restored to the regions in the middle of the month, including broadband in hotels, travel establishments, and hospitals, but with access restricted to white-listed Web sites. 2G mobile connectivity also returned, but was limited to white-listed Web sites as well.

[…] nationwide connectivity disruptions were recorded in November 2019 and January 2020,” according to a 2020 Freedom House […]
[…] nationwide connectivity disruptions were recorded in November 2019 and January 2020,” according to a 2020 Freedom House […]